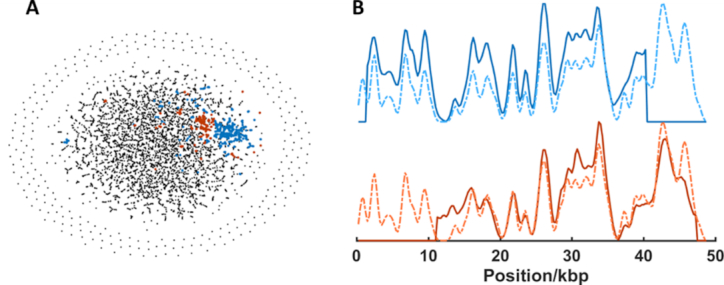
Figure 6.

Identification of Lambda bacteriophage DNA in genomic mixture by de novo separation and alignment of experimental barcodes. (A) t-SNE visualization of the communities generated from the adjacency matrix. Community detection gives rise to two clusters (blue and red points) which are matched to the lambda phage genome. A total of 475 of 5114 barcodes are in these two clusters. (B) Consensus (average) barcodes (solid lines) generated from the blue and red clusters and their alignment to the bacteriophage lambda reference genome (dotted lines).
