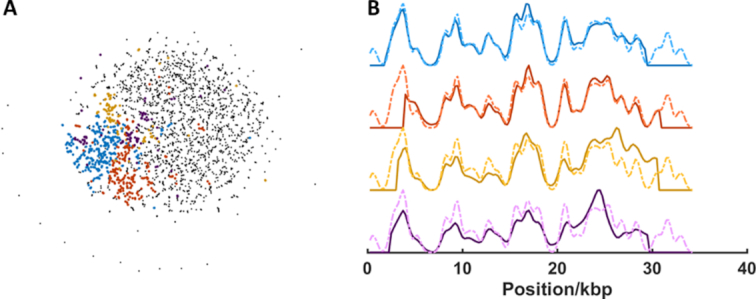
Figure 7.

Identification of human adenovirus A DNA sample by separation, de novo alignment and assignment of consensus barcode to reference library. (A) t-SNE visualization of the communities generated from the adjacency matrix. Community detection gives rise to four clusters (blue, red, yellow and purple points) which are matched to the human adenovirus A genome. 669 of 1986 barcodes (4 from 21 clusters) are assigned to adenovirus A DNA. (B) Consensus (average) barcodes (solid lines) generated from the blue, red, yellow and purple clusters and their alignment to the human adenovirus A reference genome (dotted lines).
