
Figure 1.
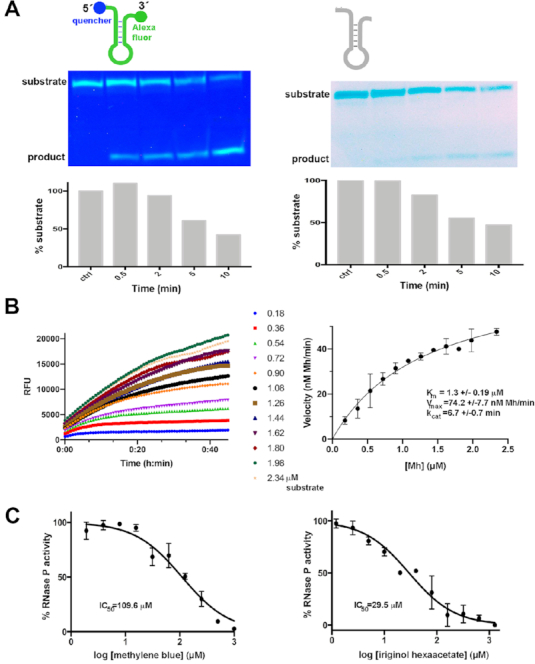
Validation of the fluorescent minihelix (Mh) substrate. (A) Cleavage by bacterial RNase P. Top. Schematic representation of the 24-nucleotide fluorescent (left) or non-fluorescent (right) minihelix (Mh) substrate with the predicted secondary structure according to Brannvall et al. (32). Middle left. RNase P holoenzyme from Thermotoga maritima cleaves the fluorescent Mh substrate, as visualized by 20% urea-PAGE under UV light. The fluorescence detected from both the substrate (upper band) and the product (lower band) is due to the unfolding of the Mh probe under the denaturing gel conditions. The time-dependent disappearance at 55°C of the 24 nt Mh fluorescent substrate (5 ng), with a simultaneous accumulation of the 15 nt product, confirms the catalytic cleavage of RNase P on the proposed minihelix. Middle right. FRET-pair addition does not affect the cleavage of RNase P on the fluorescent probe as visualized by UV after PAGE and ethidium bromide staining. Bottom. Similar time courses of substrate conversion are observed for the fluorescent (left) and non-fluorescent (right) Mh substrates. (B) Kinetic assays of RNase P with the fluorescent substrate show a typical Michaelis-Menten enzymatic behavior. Left. Representative plots of kinetic assays are shown. RNase P holoenzyme was incubated at 20°C at 11 nM, with increasing Mh concentrations as indicated. Right. Michaelis-Menten model fitting (R2 = 0.9368). Initial velocities from three independent trials were plotted against substrate concentration; error bars indicate the standard error for each plot. (C) The reported RNase P inhibitors methylene blue and iriginol hexaacetate inhibit bacterial RNase P from Thermotoga maritima. Left. The inhibition of RNase P by methylene blue. Dose-response curve (R2 = 0.9543) calculated from the normalized slope values from the linear portions of the kinetic assays in triplicate shown in Supplementary Figure S5. The reported Ki value using a conventional pre-tRNA substrate and the RNA subunit of different bacterial RNase P′s is between 14 and 28 μM (28). Right. Inhibition of RNase P by iriginol hexaacetate. Dose–response curve (R2 = 0.9556) calculated from the normalized slope values from assays in triplicate. The reported IC50 value using a fluorescent pre-tRNA substrate is 0.8 μM for Bacillus subtilis RNase P (26).