Figure 6.
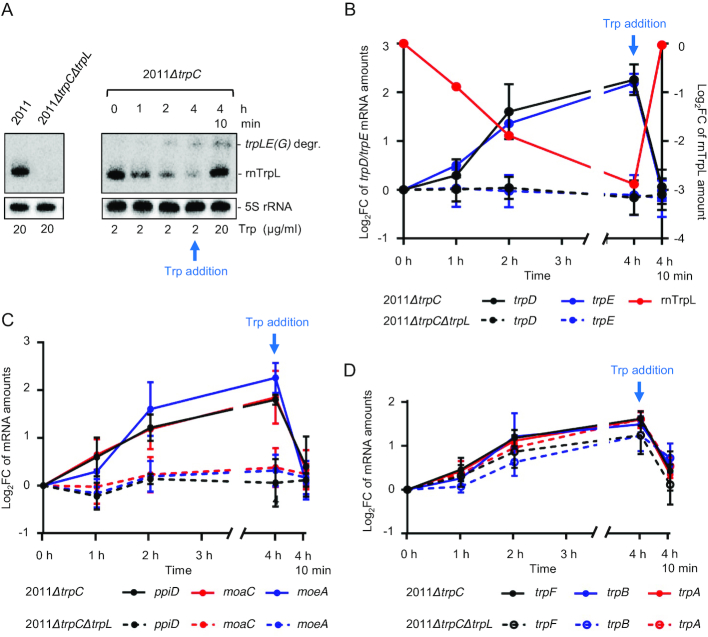
The sRNA rnTrpL down-regulates trpDC in response to Trp availability. (A) Northern blot analysis of rnTrpL, showing transcription attenuation in strain 2011ΔtrpC which was grown first in minimal medium (MM) containing 20 μg/ml Trp and then transferred to MM containing 2 μg/ml Trp for 0, 1, 2 and 4 h, respectively. Depletion of the cellular Trp pool causes cotranscription of trpL and trpE(G) and a decrease in the level of the sRNA rnTrpL. 4 h 10 min, following incubation with 2 μg/ml Trp for 4 h, the Trp concentration was increased to 20 μg/ml for 10 min. Increased Trp availability led to transcription termination at SL3 of rnTrpL and an immediate increase in the level of the sRNA rnTrpL. The band migrating slower than rnTrpL was identified as a degradation product (degr.) of the trpLE(G) cotranscript (see Supplementary Figure S5). On the left, RNA isolated from the indicated control strains grown in media with 20 μg/ml Trp was loaded. All lanes shown in this panel originate from the same blot. (B) Changes in trpE, trpD and rnTrpL RNA levels in response to Trp availability in the indicated strains. Relative trpD and trpE mRNA levels were measured by qRT-PCR using RNA samples from Trp availability experiments (as shown in panel A). The levels measured at the indicated time points were compared to the level determined at time point 0. (C) Changes in ppiD, moaC and moeA RNA levels in response to Trp availability in the indicated strains. For details, see B). (D) Changes in trpF, trpB and trpA mRNA levels in response to Trp availability in the indicated strains. For details, see B). All mRNA graphs show means and standard deviations from three independent experiments, each performed in duplicates. The rnTrpL graph in B) shows a quantification of the signals from panel A).

