Figure 4.
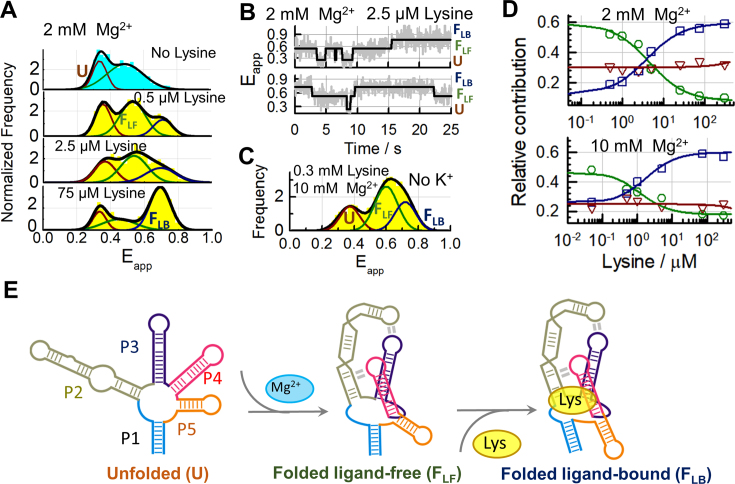
Ligand-induced re-organization of tertiary pre-organized lysine aptamers (A) Single-molecule FRET histograms obtained in the absence of ligand (cyan) and at the indicated concentrations of lysine ligand (yellow) in a background of 100 mM K+ and 2 mM Mg2+. The result from fitting each histogram to three Gaussians (black line) and the relative contributions of the U (red), FLF (green) and FLB (blue) states are also shown. (B) Representative FRET trajectories obtained in 2 mM Mg2+, 100 mM K+ and 2.5 μM lysine showing fluctuations between U, FLF and FLB states within single aptamers. The solid line represents the idealized FRET trajectory obtained using Hidden Markov modelling. (C) Single-molecule FRET histogram obtained in the absence of K+ ions at 10 mM Mg2+ ions and 300 μM lysine. (D) Variation in the relative contributions of U (Δ, red), FLF (o, green), and FLB (□, blue) states as a function of lysine concentration obtained in a background of 100 mM K+ at 2 mM (upper panel) and 10 mM (bottom panel) Mg2+. The solid lines represent the result of globally fitting the contributions of the FLF and FLB states as a function of lysine ligand concentration to a Hill model (Supplementary Methods). Dissociation constants of 4.5 ± 1 μM and 1.3 ± 0.5 μM were obtained in 2 mM and 10 mM Mg2+, respectively. (E) Proposed two-step folding and ligand-binding mechanism for the lysC aptamer at saturating concentrations of Mg2+.

