
Figure 3.
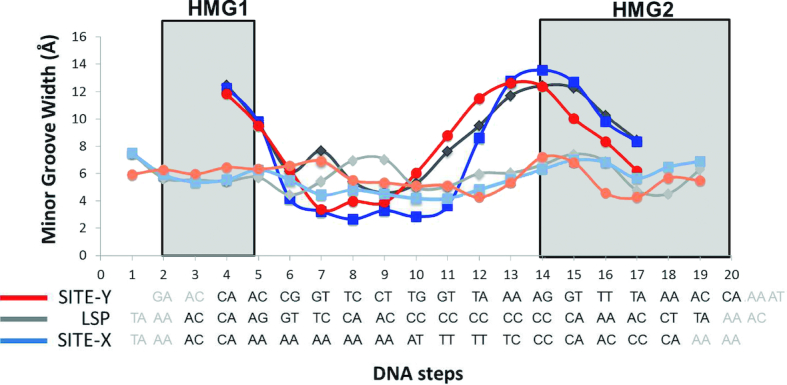
The minor groove width (Y axis) is shown for each DNA step (X axis, each DNA step is numbered). Below, the sequences are represented. Site-X is shown in light (naked) and dark (crystal) blue, Site-Y in orange and red, LSP in light and dark gray.