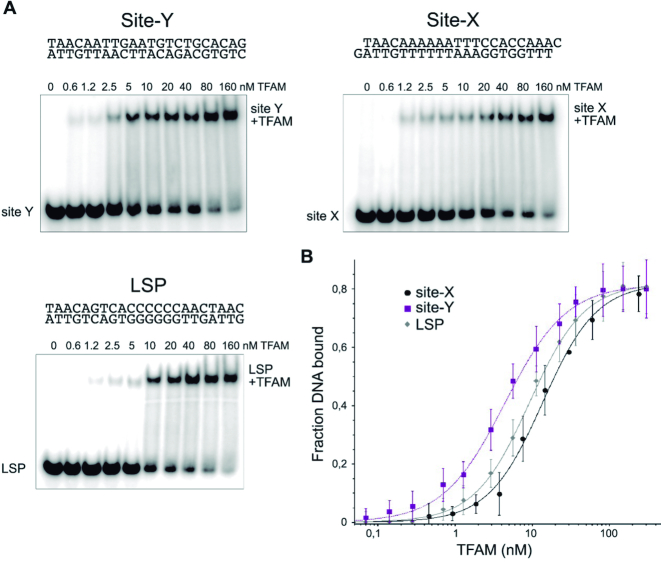
Figure 4.
Binding of TFAM to Site-Y, Site-X and LSP. In (A), gel-shift assays (EMSA) show TFAM-inducing equivalent DNA migration to all sequences. Lane ‘0’ contains free DNA (1 nM). In subsequent lanes from left to right, 32P-labeled DNA at 1 nM was titrated with TFAM at increasing amounts (as indicated above the corresponding lanes). The DNA shift corresponding to the complexes is indicated as ‘DNA+TFAM’. In (B), the measurements of TFAM binding to DNA are fitted to a modified Hill equation (see Materials and Methods). TFAM in complex with Site-X is shown with black circles; in complex with Site-Y with squares; and in complex with LSP with diamonds.

