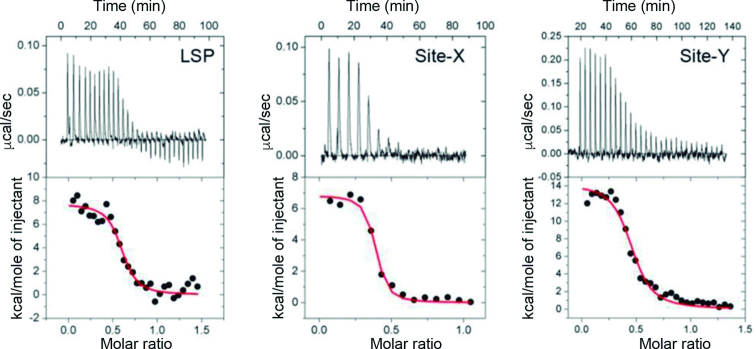
Figure 6.
Isothermal titration calorimetry of TFAM binding to LSP, Site-X and Site-Y. Top: representative isothermal titration calorimetry thermograms from the measurements done with LSP (left), Site-X (centre) and Site-Y (right). Below: fitting of the binding isotherms to a model with one binding site (red curve).

