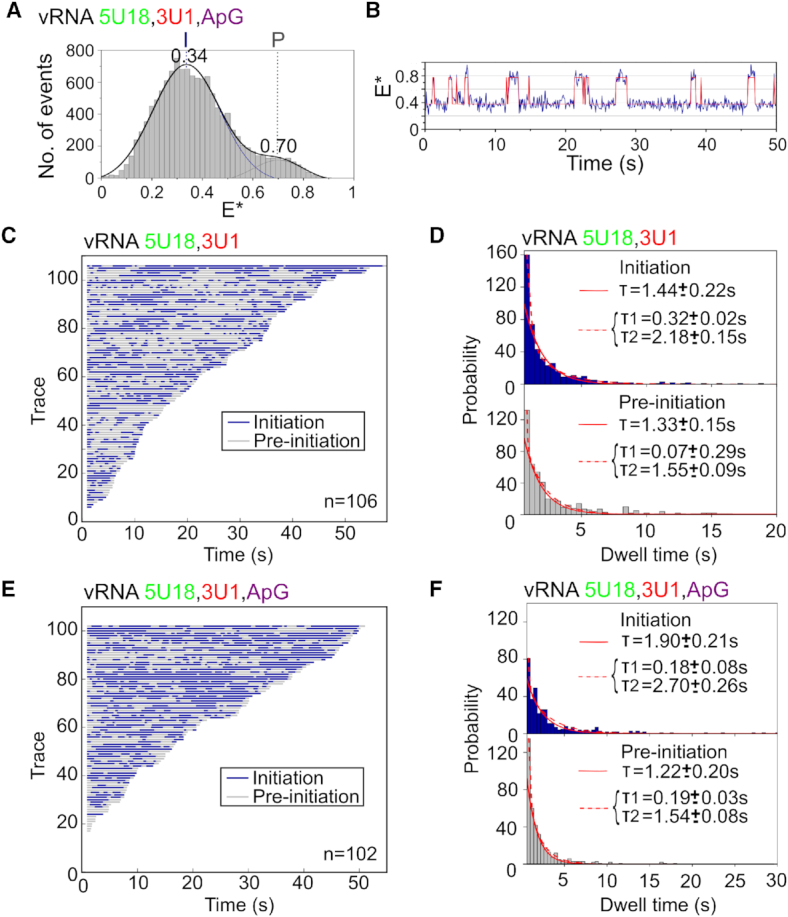
Figure 3.

Nucleotide addition stabilizes the vRNA initiation state. (A) Single-molecule FRET histogram from immobilized replication complexes after ApG addition. E* represents apparent FRET efficiency, initiation state = I, pre-initiation state = P, frame time: 100 ms. (B) Example time trace showing transitions between the initiation and pre-initiation states. (C) Hidden Markov Modeling (HMM) was used to assign the states, which were colour-coded and binarized before being depicted in a single plot from shortest to longest in length. The low-FRET initiation state is represented in blue and the high-FRET pre-initiation state represented in grey. Number of traces (n) = 106. (D) Histograms of initiation (top) and pre-initiation (bottom) dwell times for immobilized replication complexes in the absence of nucleotides. The data were fitted to single (solid red line) or double-exponential (dotted red line) functions. (E) Binarized time traces from immobilized replication complexes after 500 μM ApG addition. Number of traces (n) = 102. (F) Histograms of initiation (top) and pre-initiation (bottom) dwell times for immobilized replication complexes after ApG addition.
