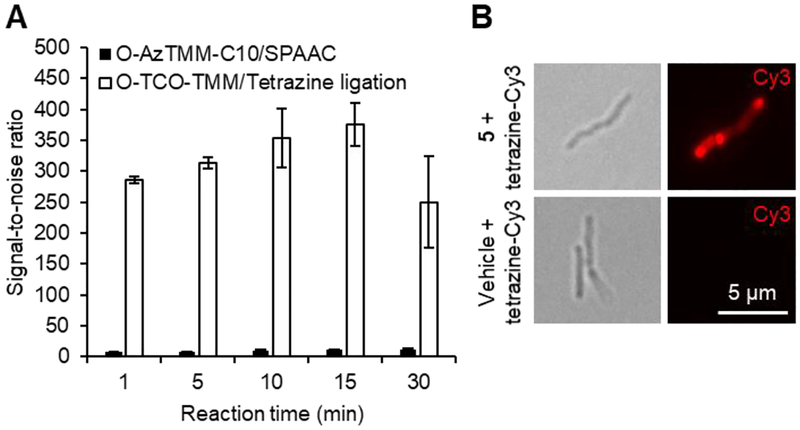
Figure 3.
(A) Cell-surface reaction kinetics comparison between O-AzTMM-C10 (4) with SPAAC and O-TCO-TMM (5) with tetrazine ligation. Msmeg was cultured in 4 or 5 (25 μM each) or left untreated, then reacted with DBCO-Cy3 or tetrazine-Cy3 (20 μM each) for varying times and analyzed by flow cytometry. Signal-to-noise ratios were determined by dividing the MFI value for the reporter-treated sample by the MFI value for the vehicle-treated control exposed to the same bioorthogonal reaction conditions. Error bars denote the standard deviation of three replicate experiments. (B) Fluorescence imaging of O-TCO-TMM-labeled Msmeg after 1 min tetrazine reaction. Scale bar (5 μm) applies to all images. Left, transmitted light images; right, fluorescence images.

