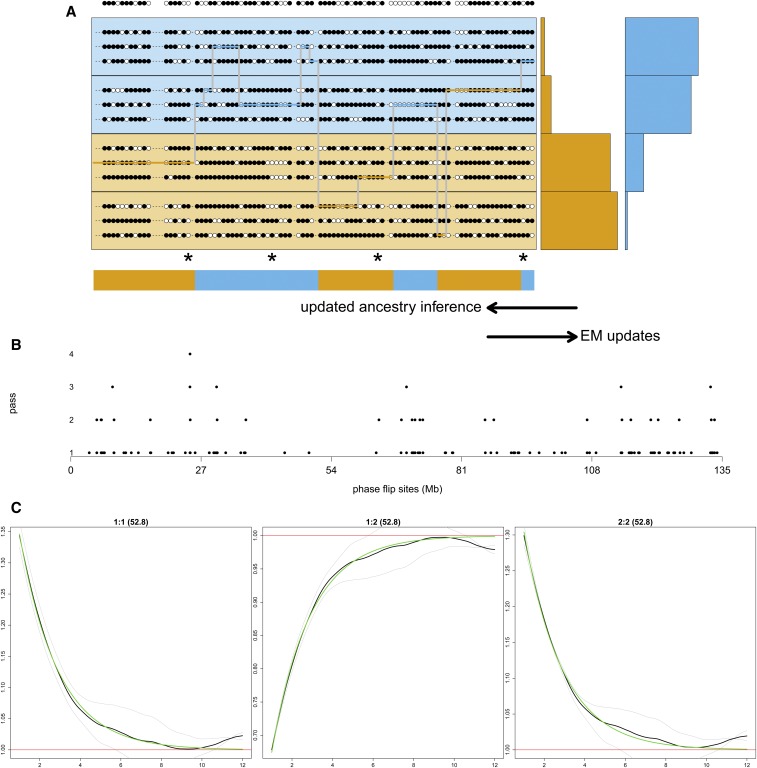
Figure 1.
MOSAIC proceeds by rounds of thin (see Thinning), EM (see EM Updates), phasing (see Rephasing). (a) is a cartoon version and (b and c) depict the simulations used to test the approach in Simulation Studies. (a) The top row is a single observed admixed haplotype. The four panels beneath it each have three reference haplotypes, in this case separable into two diverged groups (orange and blue). Local ancestry estimates (colors along the bottom) are estimated, conditional on parameter estimates including the conditional probability of selecting a panel given the local ancestry (right hand side). Estimated local ancestry is then used to update parameter estimates in an EM algorithm. A key innovation here is demonstrated by the segment second from the right, wherein a putatively blue haplotype is copied under an orange ancestry. Filled and open circles denote reference and alternative allelic types, and the asterisks denote miscopied alleles. (b) The phase-hunter method applied to a simulated admixed chromosome 10. The dots show the locations along a chromosome (x-axis) that are flipped for phase by the algorithm at successive rounds of the phase-hunter (y-axis). Fewer sites are candidates (increased log-likelihood if flipped) in each round. Just four forward-backward algorithm passes are required to find all single phase flips that increase the log-likelihood in this example. (c) Dating is estimated using the coancestry curve fitting in Dating Admixture Events Using Coancestry Curves using the exponential decay of the ratio of probabilities of pairs of local ancestries (y-axis) as a function of genetic distance (in centi-Morgans, x-axis). The green line depicts the fitted curve, the black line the across targets observed ratios, and the grey lines the per target ratio. Along the top of each panel is the index of the pair of ancestries being examined as a:b followed by the estimated decay parameter in brackets corresponding to the number of generations since admixture. In this case, 50 generations since admixture has been simulated and we demonstrate in Section S2.1 of the Supplement that bootstrapped samples (see Simple two-way admixture analysis) of the inferred date are centered around this value.

