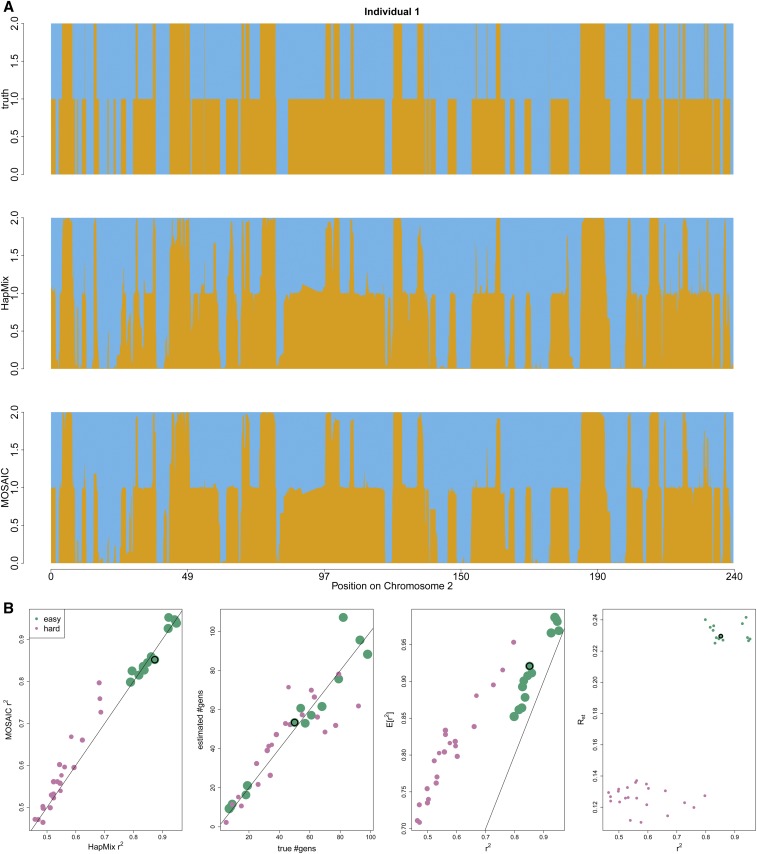
Figure 2.
Comparison between MOSAIC and HapMix in two-way admixture simulations, as described in Simulation Studies. (a) Example diploid local ancestry (orange or blue) in a simulated dataset. Top is truth, middle HapMix, bottom MOSAIC where rephasing is as per Rephasing. Both methods infer similarly accurate local ancestry; however, MOSAIC is more confident, extends to more than two-way events, and does not depend on prior knowledge of mixing groups. (b) Easy (Yoruba and French) and harder (Pathan and Mongola) admixture simulations. Left: for HapMix against MOSAIC, showing superior local ancestry estimation against the current state-of-the-art in two-way admixture, even though HapMix is provided with known reference panels and MOSAIC is not. The plotting character is sized proportional to . Left-center: true vs. inferred dates. Right-center: estimated coefficient of determination of local ancestry (Equation 2) vs. squared correlation between true and estimated local ancestry. Right: (Equation 4) against squared correlation between true and estimated local ancestry, showing that can be used to identify challenging cases. In all plots, the black circle highlights the simulation shown in (a).

