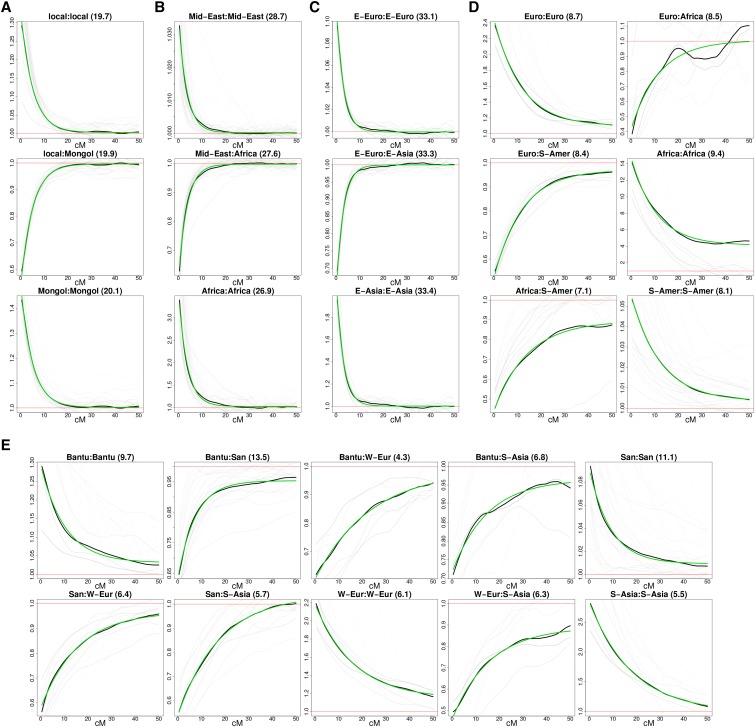
Figure 5.
(a) Hazara two-way. (b) Bedouin two-way. (c) Chuvash two-way. (d) Maya three-way. (e) SanKhomani four-way. Coancestry curves for case studies of admixture within the HGDP dataset. On the top of each subplot, the ancestry sides are labeled according to the closest donor panel as measured by (see Table 1, Table 2, Table 3, Table 4, and Table 5) and the estimated number of generations since admixture between each pair of ancestries is given in brackets. The relative probability of pairs of local ancestries (y-axis) as a function of genetic distance (in centi-Morgans, x-axis) is shown in black (across all individuals), gray (one per individual), and fitted exponential decay curve (green). The departure from the exponential decay seen in the top right panel is due to the low African and European ancestry dosages coupled with the recent admixture date, meaning that local ancestry switches between these two are rare. This low number of switches results in a noisy decay curve for each individual (gray lines).

