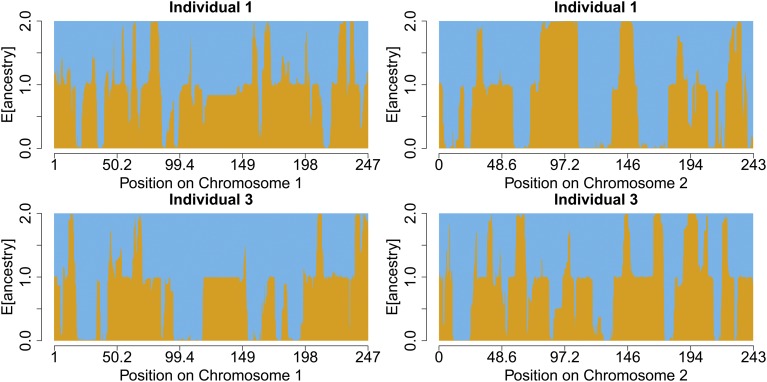
Figure 6.
Hazara estimated local ancestry on chromosomes 1 and 2 across two individuals. There is a roughly 50–50 ancestry contribution from two sources ∼20 generations ago. The orange source is Pathan like and the blue is Mongolian like (see Table 1 for details). The colors are consistent with Figure 4, which shows scaled copying proportions for each donor panel.

