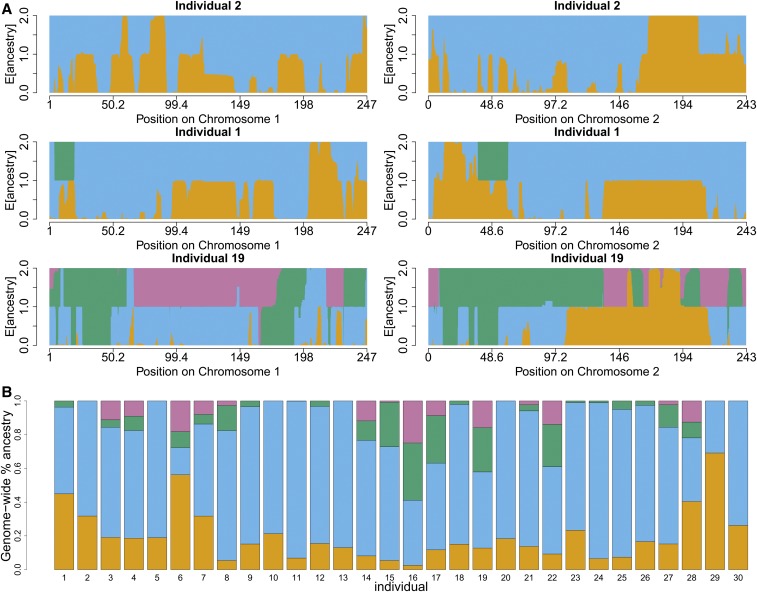
Figure 7.
Details of San-Khomani four-way admixture model fit. Each color represents one of four latent ancestries, which in this case correspond to four different ethnicities. The orange source is Bantu-like, blue is San, green is European, and purple is Asian (see Table 5 for details). The colors in these plots are consistent with Figure 4, which shows scaled copying proportions for each donor panel. On Figure 4, the San-Khomani column gives the genome-wide proportion (across all 30 analyzed individuals) of these four ancestries, and this figure shows ancestry proportions per individual as stacked bar plots. (a) San-Khomani estimated local diploid ancestry dosage (four colors) on chromosomes 1 and 2 across two individuals. The first individual has no inferred “Asian” like ancestry (see Table 5), but the other two do. (b) Diagram showing the inferred proportions of the three ancestries in the San-Khomani.

