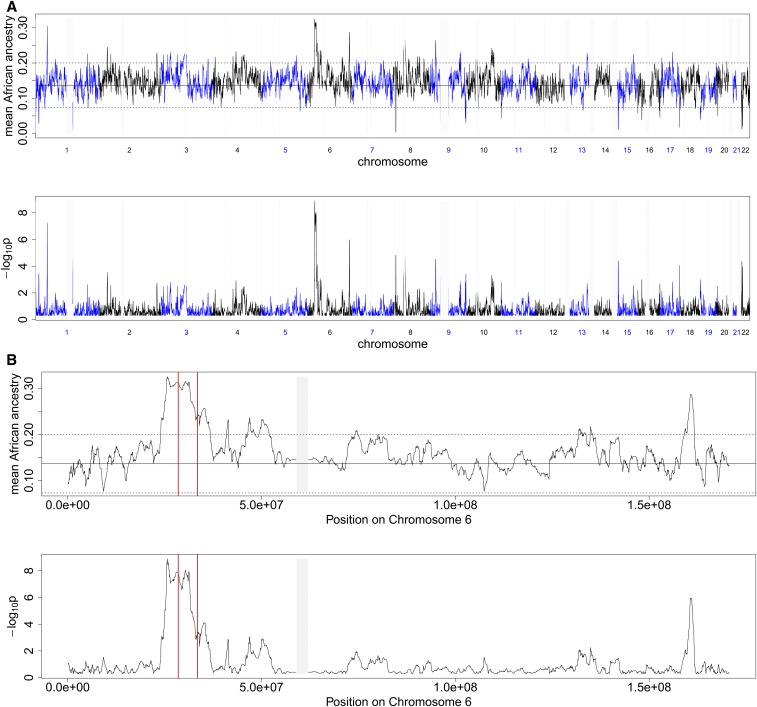
Figure 8.
Mean African Ancestry and -log10p of mean ancestry across all 220 individuals in North Africa plotted against: (a) genome position (b) Chromosome 6 position. There is a high and wide spike at the HLA (marked by two vertical red lines) on Chromosome 6 at the HLA. Note that we have blocked out (in light gray) all 1 Mb regions with <10 markers; this includes centromeres with low recombination rates and few SNPs.

