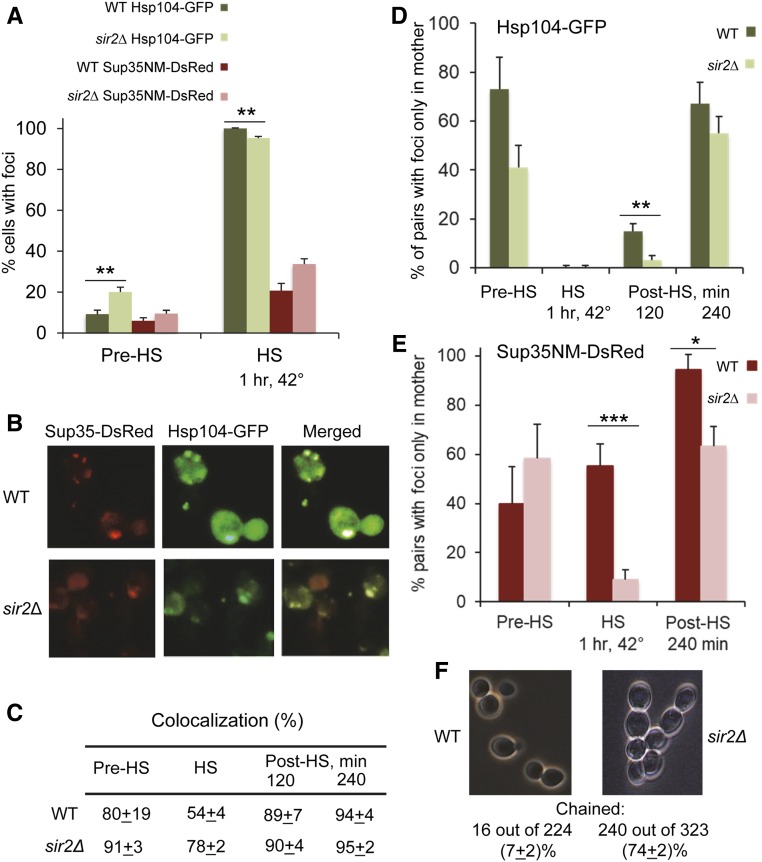
Figure 4.
Dynamics and localization of the Hsp104 and Sup35 aggregates during and after heat shock in the wild-type and sir2Δ cells. (A) Frequencies of cells with the Hsp104-GFP and Sup35NM-DsRed foci before (Pre-HS) and during (HS) heat shock for 1 hr at 42° in the wild-type (WT) and sir2Δ cells, as detected by fluorescence microscopy. Percentages of cells containing foci among all cells (Hsp104-GFP) or among all cells showing the red fluorescence (Sup35NM-DsRed) are shown. Foci were detected in one and the same culture, containing both the HSP104-GFP cassette on the chromosome and the SUP35NM-DsRed cassette on the plasmid. Numbers of cells are shown in Table S10. (B) Sup35NM-DsRed foci colocalize with Hsp104-GFP foci in both WT and sir2Δ cells. Heat shock was performed at 42° for 1 hr. (C) Quantitation of Hsp104-GFP and Sup35NM-DsRed colocalization. Percentages of colocalized dots or clumps out of all Hsp104-GFP and Sup35NM-DsRed dots or clumps detected in the cells containing both (green and red) types of aggregates are shown. In addition to before heat shock (Pre-HS) and 1 hr at 42° heat-shock (HS) data, (C) also shows data for the yeast cultures, recovering after heat shock (Post-HS) in YPD medium at 25° for specified periods of time. (D and E) Distribution of the Hsp104-GFP aggregates (D) and Sup35NM-DsRed aggregates (E), detectable by fluorescence microscopy between the mother and daughter cells before, during, and after heat shock. Numbers show percentages of cell pairs (cells with buds) containing foci only in the mother cell, out of all cell pairs where one or both cells have foci. In case of “chained” cells (see below), the mother cells producing buds at the end of the chain were considered. Designations are the same as in A and C. Cell counts are shown in Tables S11 (D) and S12 (E). (F) Sir2Δ leads to the “chained cells” phenotype, suggestive of delayed separation of cells. Numbers of chained vs. unchained cells were counted in the cultures prior to heat shock. Data are pooled from two experiments. Cells that are included in chains of three or more were considered “chained” cells. Only cells that were clearly either chained or not chained were counted. Differences between wild-type and sir2Δ cultures were statistically significant with P < 0.001. Standard deviations are shown in C. Standardized errors, calculated as described in Materials and Methods, are shown in A and D–F. Statistically significant differences in A, D, and E, as determined by Fischer’s exact test, are indicated by asterisks. Numbers of asterisks correspond to P values, as described in Figure 1 legend.

