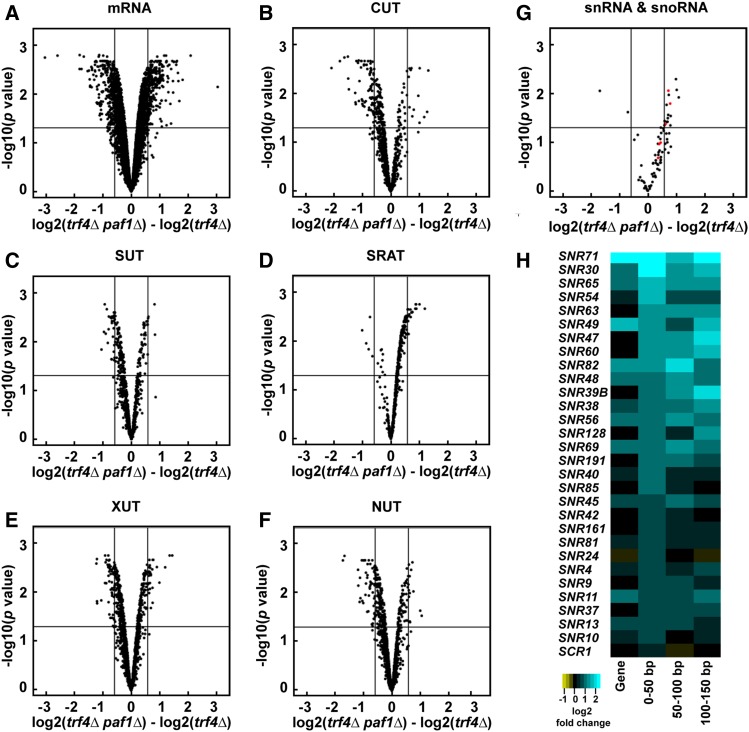
Figure 1.
Deletion of PAF1 affects all Pol II transcript classes. (A–G) Volcano plots graphing statistical significance (y-axis) against expression change (x-axis) between paf1Δ trf4Δ and trf4Δ strains (KY2016 and KY2012, respectively) for the indicated Pol II transcript classes. In (G), snRNAs and snoRNAs are shown in red and black, respectively. Each point represents an individual transcript. Tiling array probe intensities were averaged over annotated regions using a custom Python script and an average log2 fold change and P value were calculated using the limma R package. The horizontal line indicates an FDR adjusted P value of 0.05 and the vertical lines indicate a 1.5-fold change in expression (log2 fold change of 0.58). Counts and percentages of differentially expressed transcripts shown here are listed in Table S3. (H) Heatmap of log2 fold change in expression between paf1Δ and WT strains (KY1702 and KY2276, respectively) for the 29 most affected snoRNA genes. The snoRNA gene bodies and regions 0–50, 50–100, and 100–150 bp downstream of their annotated 3′ ends are plotted and sorted by the 0–50 bp region.

