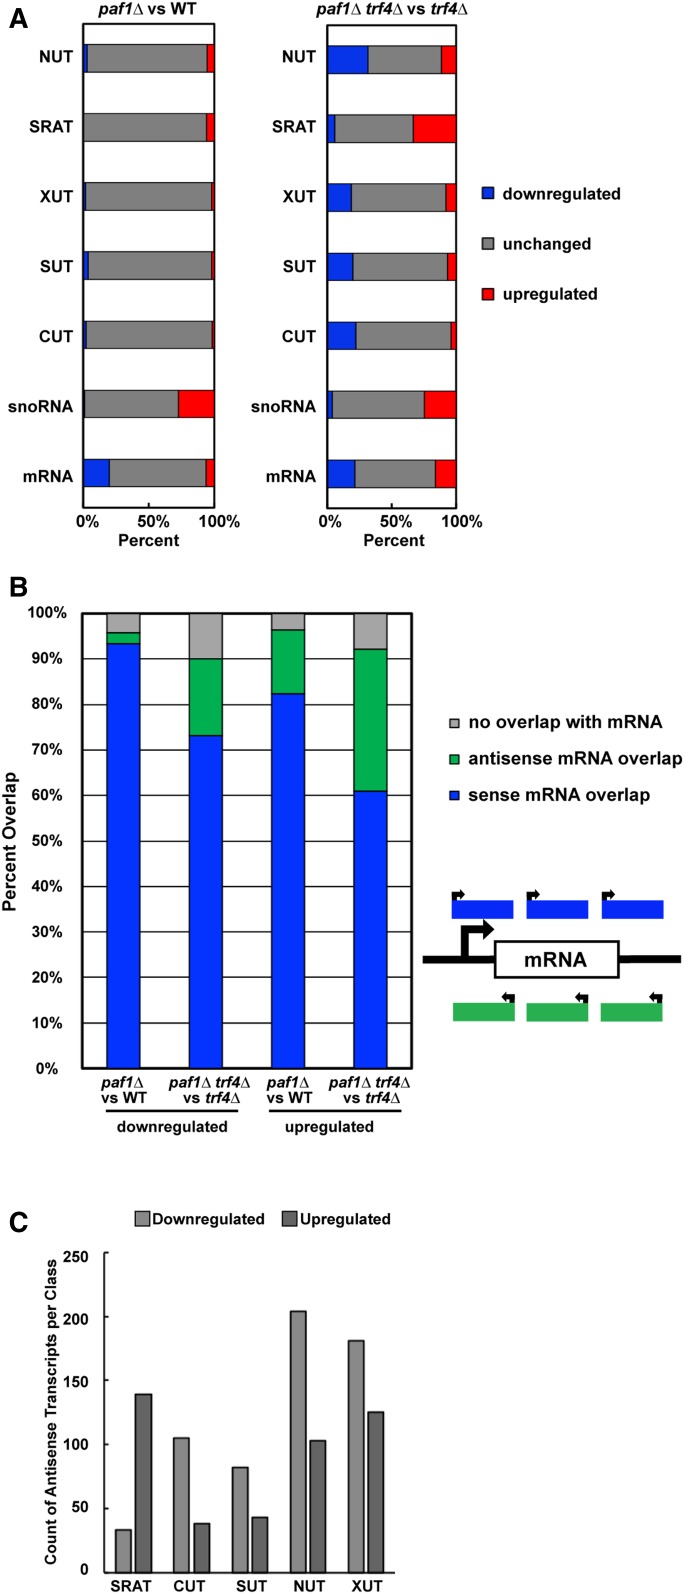
Figure 2.
Paf1 positively and negatively regulates antisense transcription. (A) Horizontally stacked bar graphs showing the percentage of each transcript class (listed in Table S2) found to overlap with a differentially expressed transcript identified in paf1∆ or paf1∆ trf4∆ strains by de novo analysis (counts and percentages listed in Table S4). (B) Vertically stacked bar graph plotting percentage of transcripts, identified in the de novo analysis, that overlap with mRNA coding regions on the sense or antisense strand. These data are also presented in Table S5. (C) Bar graph summarizing the overlap between differentially expressed antisense transcripts detected by the de novo analysis and previously annotated noncoding RNAs (see sums in Table S6 for counts).

