Figure 4.
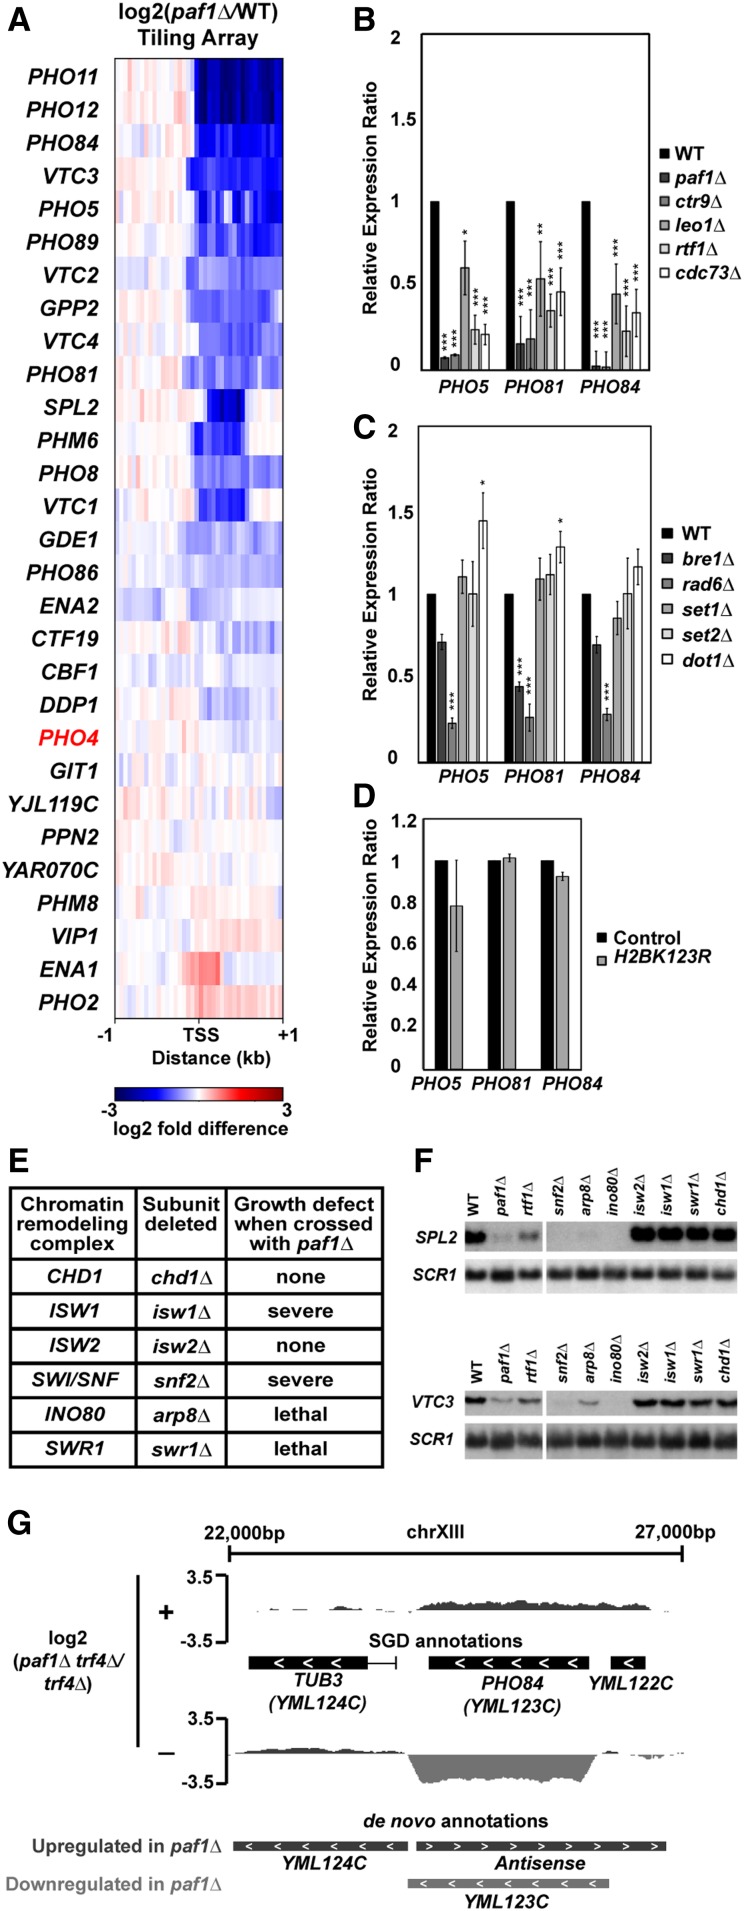
Paf1 positively regulates many phosphate homeostasis genes. (A) Heatmap of expression differences observed in a paf1Δ strain (KY1702) relative to a WT strain (KY2276) at Pho4-responsive genes (Zhou and O’Shea 2011). (B–D) RT-qPCR analysis of phosphate gene expression in strains lacking (B) individual Paf1C subunits (KY1021, KY2271, KY2239, KY2243, KY2241, and KY2244), (C) histone modification enzymes (KY1683, KY2045, KY1952, KY938, KY914, KY934) or (D) H2B K123. In (D), RNA levels in the H2B K123R mutant (KY2167) were compared to the appropriate WT control strain (KY2027). Relative expression ratio is calculated using primer efficiency, normalization to the RNA polymerase III transcript SCR1 and a comparison to a WT strain (Pfaffl 2001). Error bars represent SEM and all statistically significant results are reported as asterisks (0.01 < P < 0.05 = *, 0.001 < P < 0.01 = **, 0 < P < 0.001 = ***). All P values were derived from a Student’s t-test between the mutant strain and WT. (E) Cumulative data from crosses between a paf1∆ strain and strains deleted for chromatin remodeling factors. Following tetrad analysis of the following crosses, growth defects of double mutants were determined: chd1∆ paf1∆ = KY583 × KY804; isw1∆ paf1∆ = KY3464 × KY901; isw2∆ paf1∆ = KY884 × KY804; snf2∆ paf1∆ = KY508 × KY804; arp8∆ paf1∆ = KY3460 × KY804; swr1∆ paf1∆ = KY3462 × KY972. (F) Northern blot analysis of SPL2 and VTC3 RNA levels. Strains used in this analysis were KY292, KY802, KY457, KY508, KY3465, KY3461, KY884, KY3463, KY972, and KY632. SCR1 serves as a loading control. (G) Genome browser view showing antisense transcription at the PHO84 locus. The browser view shows smoothed differential expression tracks (log2(paf1∆ trf4∆/trf4∆), 160 bp sliding window) with both SGD and de novo transcript annotations. Plus (+) and minus (−) symbols refer to DNA strand. The PHO84 gene is oriented right to left.

