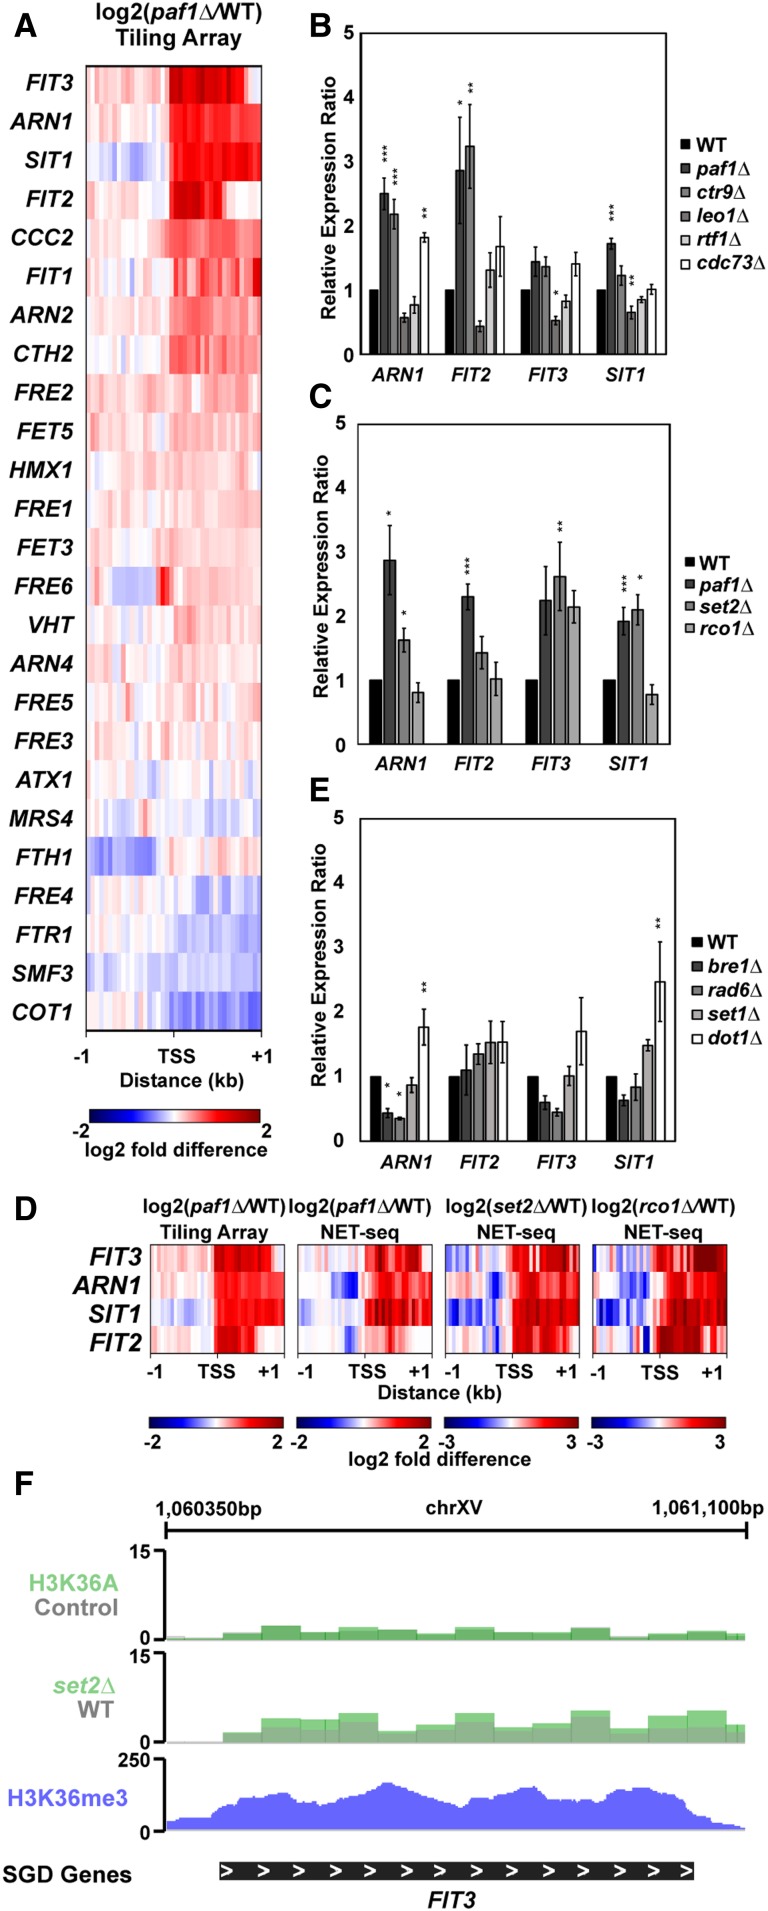
Figure 5.
Paf1 represses iron homeostasis genes. (A) Heatmap of expression differences observed in a paf1Δ strain (KY1702) relative to a WT strain (KY2276) at Aft1 and Aft2 responsive genes involved in maintenance of iron homeostasis (Cyert and Philpott 2013). (B and C) RT-qPCR analysis of the indicated genes in strains lacking (B) individual Paf1C subunits (KY1021, KY2271, KY2239, KY2243, KY2241, and KY2244) or (C) genes in the Set2/Rpd3S pathway (KY307, KY914, KY1702, and KY1235). Calculation of the relative expression ratio and statistical testing were performed as in Figure 4. (D) Heatmaps of expression differences between mutant yeast strains and their respective WT strains in tiling array (this study) and NET-seq (Churchman and Weissman 2011; Harlen and Churchman 2017) datasets. (E) RT-qPCR results for iron homeostasis genes in strains lacking enzymes that catalyze Paf1C-associated histone modifications (KY1683, KY2045, KY1952, KY938, and KY934). (F) Genome browser view of the FIT3 locus showing H3 K36A and set2∆ RNA-seq data from Venkatesh et al. (2016) and H3 K36me3 occupancy data from Weiner et al. (2015).

