Figure 2.
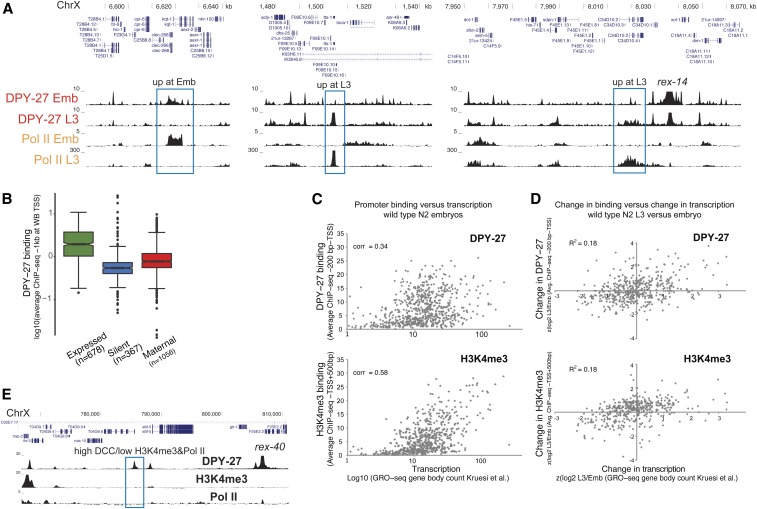
DCC enrichment at promoters partially correlates with transcriptional activity. (A) DPY-27 ChIP-seq binding across example X chromosomal regions with differential transcription, as shown by Pol II ChIP-seq in embryos vs. L3s. (B) Average DPY-27 ChIP-seq score at 1-kb windows centering around the X chromosomal WB-defined TSS sites were plotted. Genes were categorized as expressed [N2 embryos FPKM > 1 (Kramer et al. 2015) and detected in GRO-seq (Kruesi et al. 2013)], silent (FPKM = 0 and not detected in GRO-seq), and maternally loaded (FPKM > 1 and not detected in GRO-seq). (C) Average DPY-27 and H3K4me3 ChIP-seq scores at proximal promoters [200 bp downstream to – TSS defined by Kruesi et al. (2013)] were plotted on the y-axis, and transcription levels of genes [GRO-seq counts at corresponding gene bodies (Kruesi et al. 2013)] were plotted on the x-axis. Spearman’s rank correlation coefficients are shown on the top left of each plot. (D) Changes in DPY-27 binding at promoters on the y-axis [z score of log2 L3/embryo ratio of average ChIP-seq score within proximal promoters as in (C)] were compared to changes in transcription on the x-axis [z score of log2 L3/embryo of transcription level as in (C)] in L3 vs. embryos. Changes in DPY-27 and H3K4me3 partially correlate with the change in transcription at individual promoters. (E) University of California, Santa Cruz browser view of DPY-27, H3K4me3, and Pol II ChIP-seq signals across a 40-kb region containing a recruitment site. The DCC-binding peak highlighted with a blue rectangle shows low Pol II and H3K4me3, suggesting that DCC enrichment and transcriptional activity at promoters can be uncoupled. ChIP-seq, chromatin immunoprecipitation sequencing; Chr, chromosome; DCC, dosage compensation complex; FPKM, fragments per kilobase of transcript per million mapped reads; GRO-seq, global run-on sequencing; Pol II, RNA polymerase II; TSS, transcription start site; WB, WormBase.

