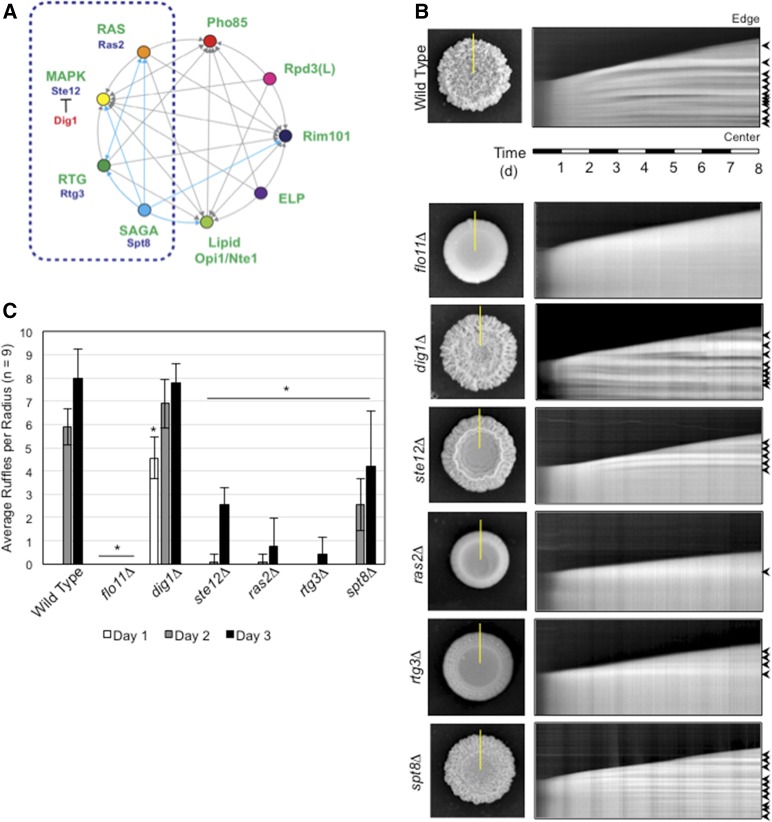
Figure 1.
Functionally interconnected signaling pathways regulate mat expansion and colony pattern formation over time. (A) Circles represent signaling pathways or regulatory complexes that control filamentous growth. Arrows refer to target genes coregulated by pathways, as adapted from Chavel et al. (2014). Cyan arrows refer to functional connections identified in this study. The dashed blue box marks the part of the network on which the study is focused. (B) Time-course experiment of colony pattern formation in wild-type cells and the indicated mutants. Colony expansion was examined over an 8-day time period (Videos S1–S7). In the left panels, colonies at the 8-day time period are shown. On the right are kymographs that show colony expansion over time. The yellow lines in the left panels refer to the region selected for kymograph analysis. The panels on the right show colony patterns that developed over time in the region selected by the yellow line, where the bottom of the figure represents the colony center and the top represents the colony perimeter (edge). Arrows mark features that are characteristic of ruffle formation, which is quantitated in (C). (C) Bar graph showing the average number of ruffles in wild-type and the indicated mutant colonies at t = 1 day (white), 2 days (gray), and 3 days (black). Error bars represent SD among nine radii from three biological replicates. * P < 0.05 between the mutant and wild-type for the same time point.

