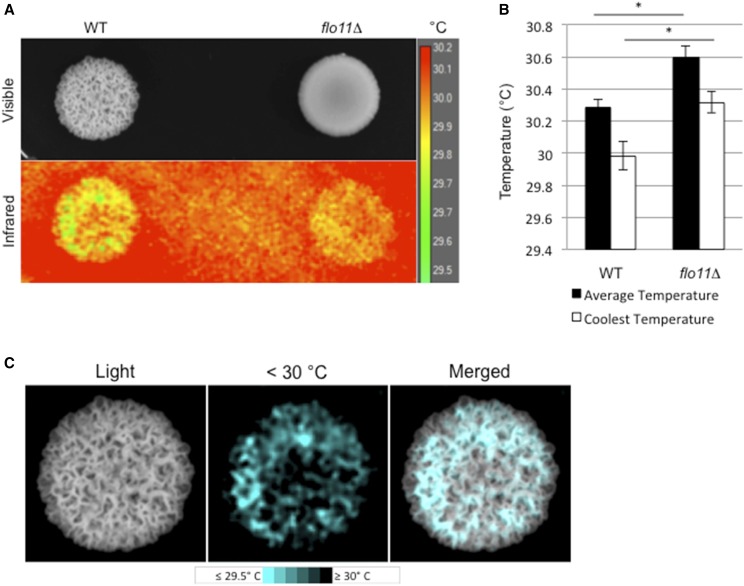
Figure 8.
Effect of cell–cell adhesion on thermoregulation. (A) Visible and infrared images of WT and flo11Δ colonies. Colonies were incubated at 30° and removed from the incubator. The image was taken at < 30 sec after removal of lid. Scale temperature in degrees Celsius. (B) Difference in average and coolest recorded temperatures between WT and flo11Δ. * P < 0.05, n = 6. (C) Visible light (Light) and thermal images of cool colony regions (< 30°) of the WT colony from (A). “Merged” shows the overlapping of cool regions with colony ruffles. WT, wild-type.

