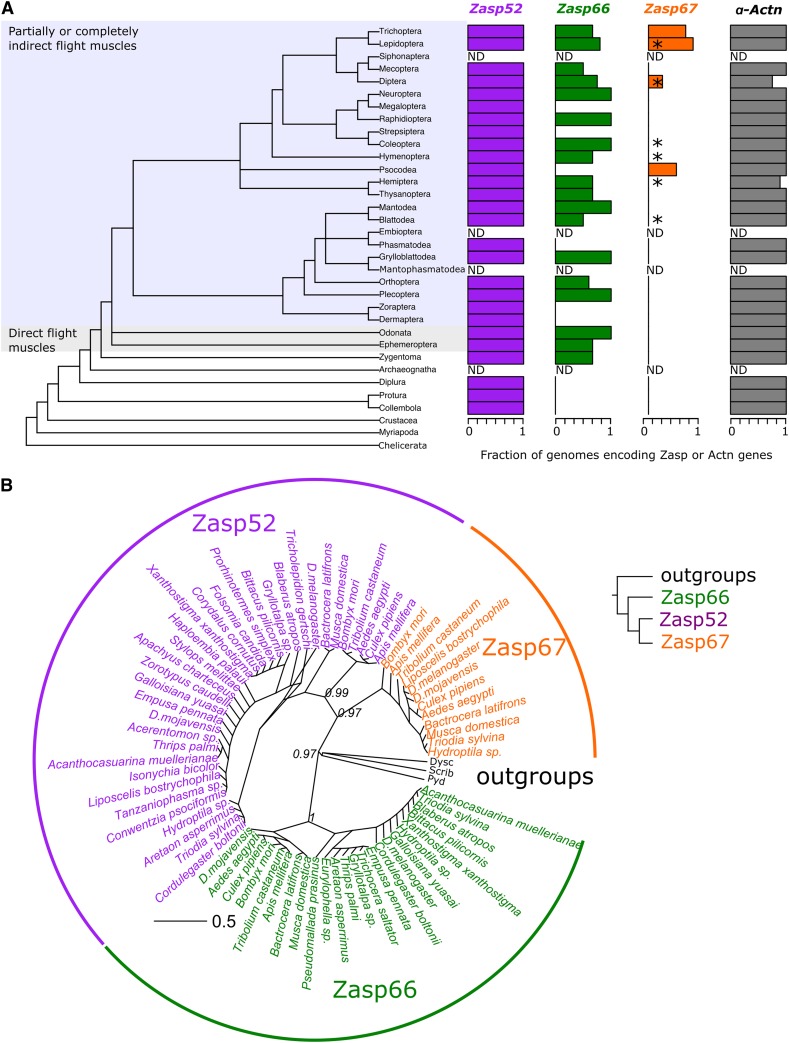
Figure 1.
Phylogeny of Zasp proteins. (A) Phylogenetic tree of insects based on Misof et al. (2014). Insects with partially or completely indirect flight muscles and insects with direct flight muscles only are highlighted. Branch names indicate the insect order (left panel). Bar plots indicate the relative number of orthologs found per insect order in the 1Kite database. ND: no whole genome sequence data available. The asterisks on the Zasp67 bar plot denote orthologs found in the NCBI nonredundant protein database. The y-axis of the plots matches the branch name from the phylogenetic tree. Accession numbers are provided in Table S1. (B) Radial phylogenetic tree of the PDZ domain regions of Zasp proteins with bootstrap support values. Zasp52 (magenta), Zasp66 (green), and Zasp67 (orange) orthologs from selected species are shown as tip labels. The PDZ regions from three closely related non-Zasp proteins (Polychaetoid-Pyd, Scribbled-Scrib, and Dyschronic-Dysc) from Drosophila melanogaster were used as outgroups and are shown in black. Numbers next to the tree nodes denote the bootstrap support value. The distance scale represents the number of amino acid changes per site. The simplified tree on the right summarizes the phylogenetic relationships. Accession numbers are provided in Table S2.

