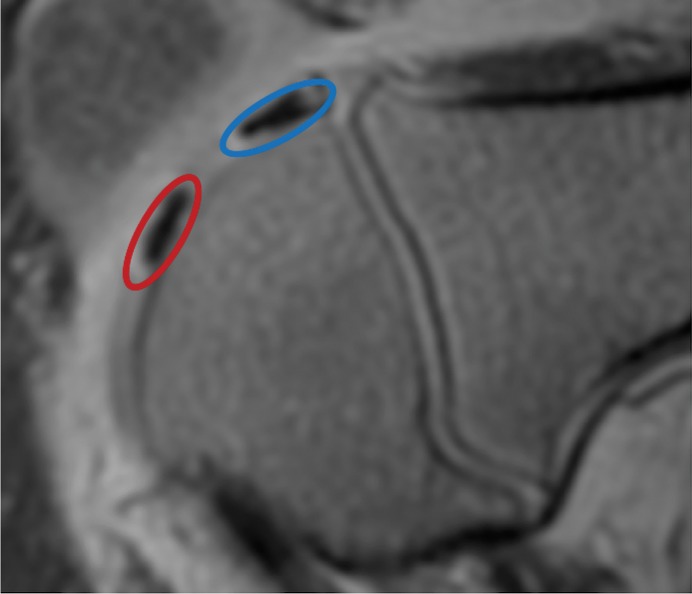
Figure 4a:
MRI and histologic assessment of labeled viable and apoptotic matrix-associated stem cell implants (MASIs) in cartilage defects of Göttingen minipigs. (a) Sagittal image from proton density–weighted MRI and (b) corresponding color-encoded T2 map overlaid on a T2-weighted spin-echo image obtained 1 week after implantation show similar iron signals and T2 relaxation times for ferumoxytol-labeled viable (blue circle) and apoptotic (red circle) MASIs. (c) Safranin O staining 3 months after the MASI procedure shows better regeneration of the cartilage defect that was implanted with a viable MASI (blue frame) compared with the cartilage defect that was implanted with an apoptotic MASI (red frame). Scale bars = 1000 µm. (d) Sagittal image from proton density–weighted MRI and (e) corresponding color-encoded T2 map overlaid on an image from T2-weighted spin-echo MRI performed at week 2 after implantation show loss of iron signal and increased T2 relaxation time in the apoptotic implant (red circle) but not in the viable transplant (blue circle). (f) Immunofluorescent staining of collagen1 (green) and collagen 2 (red) 3 months after the MASI procedure show better regeneration of the cartilage defect that was implanted with a viable MASI (blue frame) compared with the cartilage defect that was implanted with an apoptotic MASI (red frame). Scale bars = 1000 µm. (g) Scatterplot shows corresponding T2 relaxation times at week 1 and weeks 2, 4, 8, 12, and 24 after implantation of viable (blue) and apoptotic (red) ferumoxytol-labeled MASIs. Mean data in the two groups were significantly different at week 2 (P = .001). (h, i) Scatterplots of (h) quantitative measures of collagen 2 production of viable (blue) and apoptotic (red) MASIs at 3 months and (i) Pineda scores of viable (blue) and apoptotic (red) MASIs at 3 months show better cartilage regeneration outcomes for viable MASIs than for apoptotic MASIs (P < .001 and P = .03, respectively). Data are means and standard errors of the mean.

