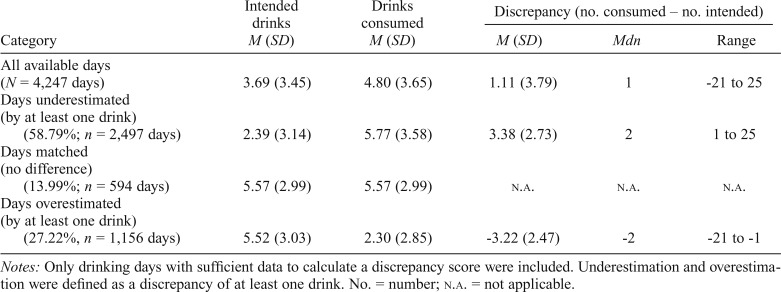
Table 1.
Descriptive information on intended drinks, drinks consumed, and their discrepancy
| Discrepancy (no. consumed – no. intended) |
|||||
| Category | M (SD) | M (SD) | M (SD) | Mdn | Range |
| All available days (N = 4,247 days) | 3.69 (3.45) | 4.80 (3.65) | 1.11 (3.79) | 1 | -21 to 25 |
| Days underestimated (by at least one drink) (58.79%; n = 2,497 days) | 2.39 (3.14) | 5.77 (3.58) | 3.38 (2.73) | 2 | 1 to 25 |
| Days matched (no difference) (13.99%; n = 594 days) | 5.57 (2.99) | 5.57 (2.99) | N.A. | N.A. | N.A. |
| Days overestimated (by at least one drink) (27.22%, n = 1,156 days) | 5.52 (3.03) | 2.30 (2.85) | -3.22 (2.47) | -2 | -21 to -1 |
Notes: Only drinking days with sufficient data to calculate a discrepancy score were included. Underestimation and overestimation were defined as a discrepancy of at least one drink. No. = number; n.a. = not applicable.

