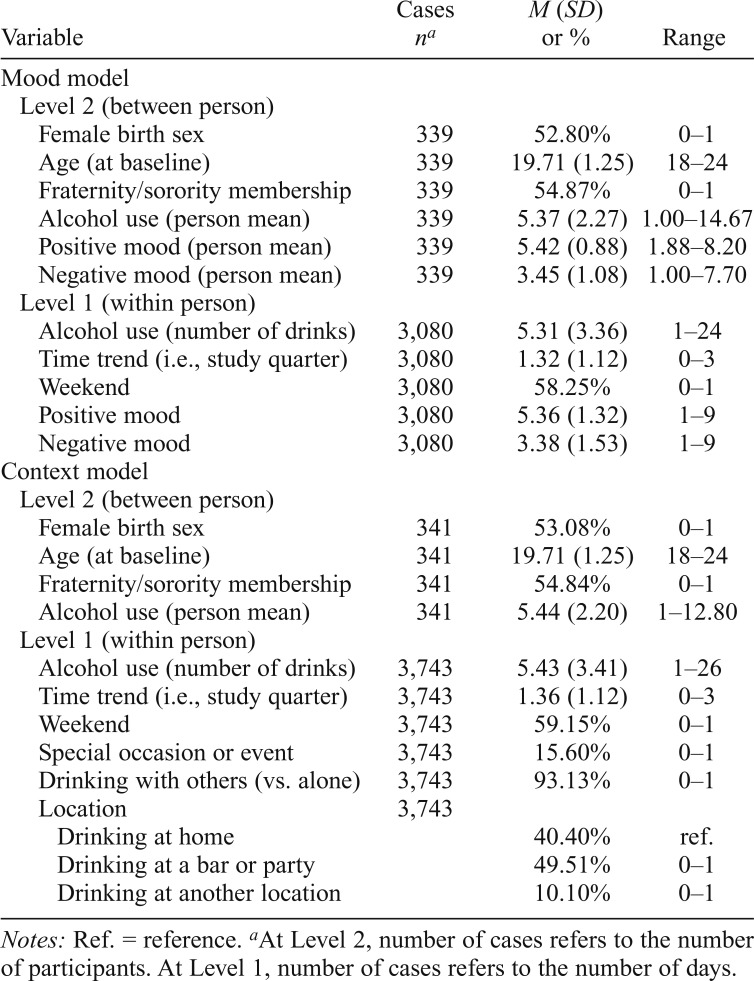
Table 2.
Descriptive statistics on the variables in the multilevel models predicting unplanned heavy drinking
| Variable | Cases na | M (SD) or % | Range |
| Mood model | |||
| Level 2 (between person) | |||
| Female birth sex | 339 | 52.80% | 0–1 |
| Age (at baseline) | 339 | 19.71 (1.25) | 18–24 |
| Fraternity/sorority membership | 339 | 54.87% | 0–1 |
| Alcohol use (person mean) | 339 | 5.37 (2.27) | 1.00–14.67 |
| Positive mood (person mean) | 339 | 5.42 (0.88) | 1.88–8.20 |
| Negative mood (person mean) | 339 | 3.45 (1.08) | 1.00–7.70 |
| Level 1 (within person) | |||
| Alcohol use (number of drinks) | 3,080 | 5.31 (3.36) | 1–24 |
| Time trend (i.e., study quarter) | 3,080 | 1.32 (1.12) | 0–3 |
| Weekend | 3,080 | 58.25% | 0–1 |
| Positive mood | 3,080 | 5.36 (1.32) | 1–9 |
| Negative mood | 3,080 | 3.38 (1.53) | 1–9 |
| Context model | |||
| Level 2 (between person) | |||
| Female birth sex | 341 | 53.08% | 0–1 |
| Age (at baseline) | 341 | 19.71 (1.25) | 18–24 |
| Fraternity/sorority membership | 341 | 54.84% | 0–1 |
| Alcohol use (person mean) | 341 | 5.44 (2.20) | 1–12.80 |
| Level 1 (within person) | |||
| Alcohol use (number of drinks) | 3,743 | 5.43 (3.41) | 1–26 |
| Time trend (i.e., study quarter) | 3,743 | 1.36 (1.12) | 0–3 |
| Weekend | 3,743 | 59.15% | 0–1 |
| Special occasion or event | 3,743 | 15.60% | 0–1 |
| Drinking with others (vs. alone) | 3,743 | 93.13% | 0–1 |
| Location | 3,743 | ||
| Drinking at home | 40.40% | ref. | |
| Drinking at a bar or party | 49.51% | 0–1 | |
| Drinking at another location | 10.10% | 0–1 |
Notes: Ref. = reference.
At Level 2, number of cases refers to the number of participants. At Level 1, number of cases refers to the number of days.

