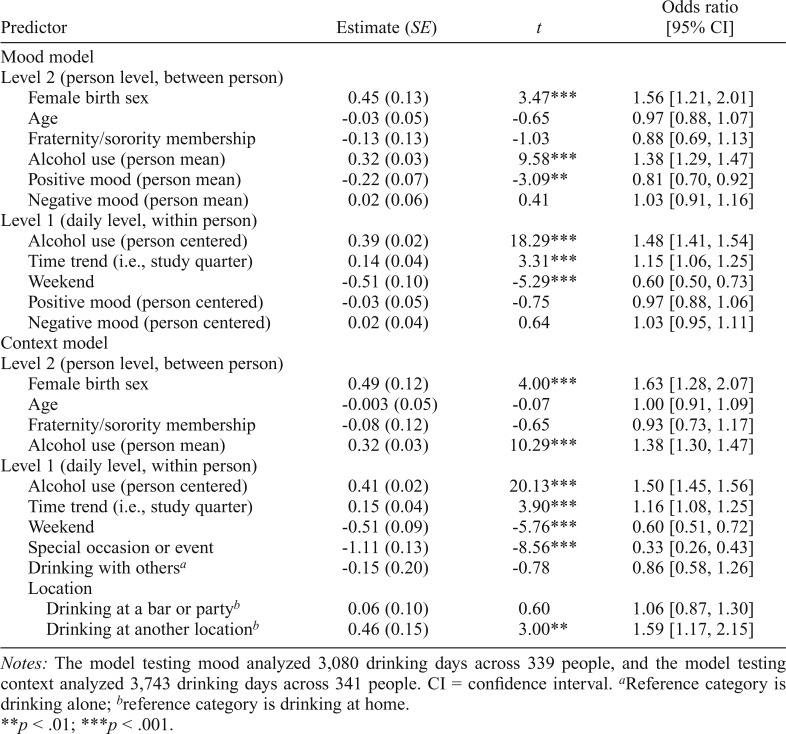
Table 3.
Multilevel models testing mood and context as predictors of unplanned heavy drinking
| Odds ratio | |||
| Predictor | Estimate (SE) | t | [95% CI] |
| Mood model | |||
| Level 2 (person level, between person) | |||
| Female birth sex | 0.45 (0.13) | 3.47*** | 1.56 [1.21, 2.01] |
| Age | -0.03 (0.05) | -0.65 | 0.97 [0.88, 1.07] |
| Fraternity/sorority membership | -0.13 (0.13) | -1.03 | 0.88 [0.69, 1.13] |
| Alcohol use (person mean) | 0.32 (0.03) | 9.58*** | 1.38 [1.29, 1.47] |
| Positive mood (person mean) | -0.22 (0.07) | -3.09** | 0.81 [0.70, 0.92] |
| Negative mood (person mean) | 0.02 (0.06) | 0.41 | 1.03 [0.91, 1.16] |
| Level 1 (daily level, within person) | |||
| Alcohol use (person centered) | 0.39 (0.02) | 18.29*** | 1.48 [1.41, 1.54] |
| Time trend (i.e., study quarter) | 0.14 (0.04) | 3.31*** | 1.15 [1.06, 1.25] |
| Weekend | -0.51 (0.10) | -5.29*** | 0.60 [0.50, 0.73] |
| Positive mood (person centered) | -0.03 (0.05) | -0.75 | 0.97 [0.88, 1.06] |
| Negative mood (person centered) | 0.02 (0.04) | 0.64 | 1.03 [0.95, 1.11] |
| Context model | |||
| Level 2 (person level, between person) | |||
| Female birth sex | 0.49 (0.12) | 4.00*** | 1.63 [1.28, 2.07] |
| Age | -0.003 (0.05) | -0.07 | 1.00 [0.91, 1.09] |
| Fraternity/sorority membership | -0.08 (0.12) | -0.65 | 0.93 [0.73, 1.17] |
| Alcohol use (person mean) | 0.32 (0.03) | 10.29*** | 1.38 [1.30, 1.47] |
| Level 1 (daily level, within person) | |||
| Alcohol use (person centered) | 0.41 (0.02) | 20.13*** | 1.50 [1.45, 1.56] |
| Time trend (i.e., study quarter) | 0.15 (0.04) | 3.90*** | 1.16 [1.08, 1.25] |
| Weekend | -0.51 (0.09) | -5.76*** | 0.60 [0.51, 0.72] |
| Special occasion or event | -1.11 (0.13) | -8.56*** | 0.33 [0.26, 0.43] |
| Drinking with othersa | -0.15 (0.20) | -0.78 | 0.86 [0.58, 1.26] |
| Location | |||
| Drinking at a bar or partyb | 0.06 (0.10) | 0.60 | 1.06 [0.87, 1.30] |
| Drinking at another locationb | 0.46 (0.15) | 3.00** | 1.59 [1.17, 2.15] |
Notes: The model testing mood analyzed 3,080 drinking days across 339 people, and the model testing context analyzed 3,743 drinking days across 341 people. CI = confidence interval.
Reference category is drinking alone
reference category is drinking at home.
p < .01
p < .001.

