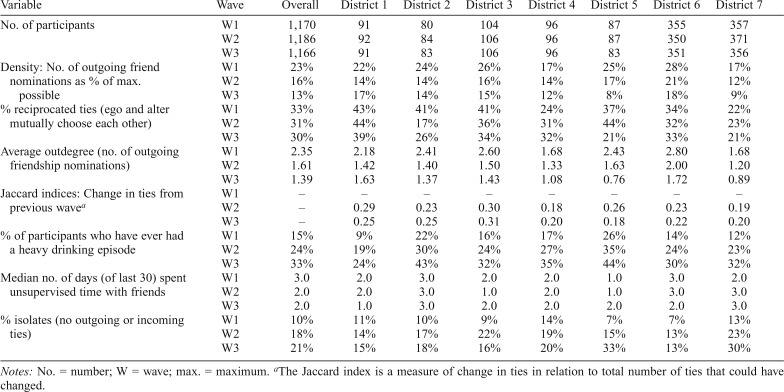
Table 2.
Descriptive statistics of district networks and students by wave
| Variable | Wave | Overall | District 1 | District 2 | District 3 | District 4 | District 5 | District 6 | District 7 |
| No. of participants | W1 | 1,170 | 91 | 80 | 104 | 96 | 87 | 355 | 357 |
| W2 | 1,186 | 92 | 84 | 106 | 96 | 87 | 350 | 371 | |
| W3 | 1,166 | 91 | 83 | 106 | 96 | 83 | 351 | 356 | |
| Density: No. of outgoing friend nominations as % of max. possible | W1 | 23% | 22% | 24% | 26% | 17% | 25% | 28% | 17% |
| W2 | 16% | 14% | 14% | 16% | 14% | 17% | 21% | 12% | |
| W3 | 13% | 17% | 14% | 15% | 12% | 8% | 18% | 9% | |
| % reciprocated ties (ego and alter mutually choose each other) | W1 | 33% | 43% | 41% | 41% | 24% | 37% | 34% | 22% |
| W2 | 31% | 44% | 17% | 36% | 31% | 44% | 32% | 23% | |
| W3 | 30% | 39% | 26% | 34% | 32% | 21% | 33% | 21% | |
| Average outdegree (no. of outgoing friendship nominations) | W1 | 2.35 | 2.18 | 2.41 | 2.60 | 1.68 | 2.43 | 2.80 | 1.68 |
| W2 | 1.61 | 1.42 | 1.40 | 1.50 | 1.33 | 1.63 | 2.00 | 1.20 | |
| W3 | 1.39 | 1.63 | 1.37 | 1.43 | 1.08 | 0.76 | 1.72 | 0.89 | |
| Jaccard indices: Change in ties from previous wavea | W1 | – | – | – | – | – | – | – | – |
| W2 | – | 0.29 | 0.23 | 0.30 | 0.18 | 0.26 | 0.23 | 0.19 | |
| W3 | – | 0.25 | 0.25 | 0.31 | 0.20 | 0.18 | 0.22 | 0.20 | |
| % of participants who have ever had a heavy drinking episode | W1 | 15% | 9% | 22% | 16% | 17% | 26% | 14% | 12% |
| W2 | 24% | 19% | 30% | 24% | 27% | 35% | 24% | 23% | |
| W3 | 33% | 24% | 43% | 32% | 35% | 44% | 30% | 32% | |
| Median no. of days (of last 30) spent unsupervised time with friends | W1 | 3.0 | 2.0 | 3.0 | 2.0 | 2.0 | 1.0 | 3.0 | 2.0 |
| W2 | 2.0 | 2.0 | 3.0 | 1.0 | 2.0 | 1.0 | 3.0 | 3.0 | |
| W3 | 2.0 | 1.0 | 3.0 | 2.0 | 2.0 | 2.0 | 2.0 | 3.0 | |
| % isolates (no outgoing or incoming ties) | W1 | 10% | 11% | 10% | 9% | 14% | 7% | 7% | 13% |
| W2 | 18% | 14% | 17% | 22% | 19% | 15% | 13% | 23% | |
| W3 | 21% | 15% | 18% | 16% | 20% | 33% | 13% | 30% |
Notes: No. = number; W = wave; max. = maximum.
The Jaccard index is a measure of change in ties in relation to total number of ties that could have changed.

