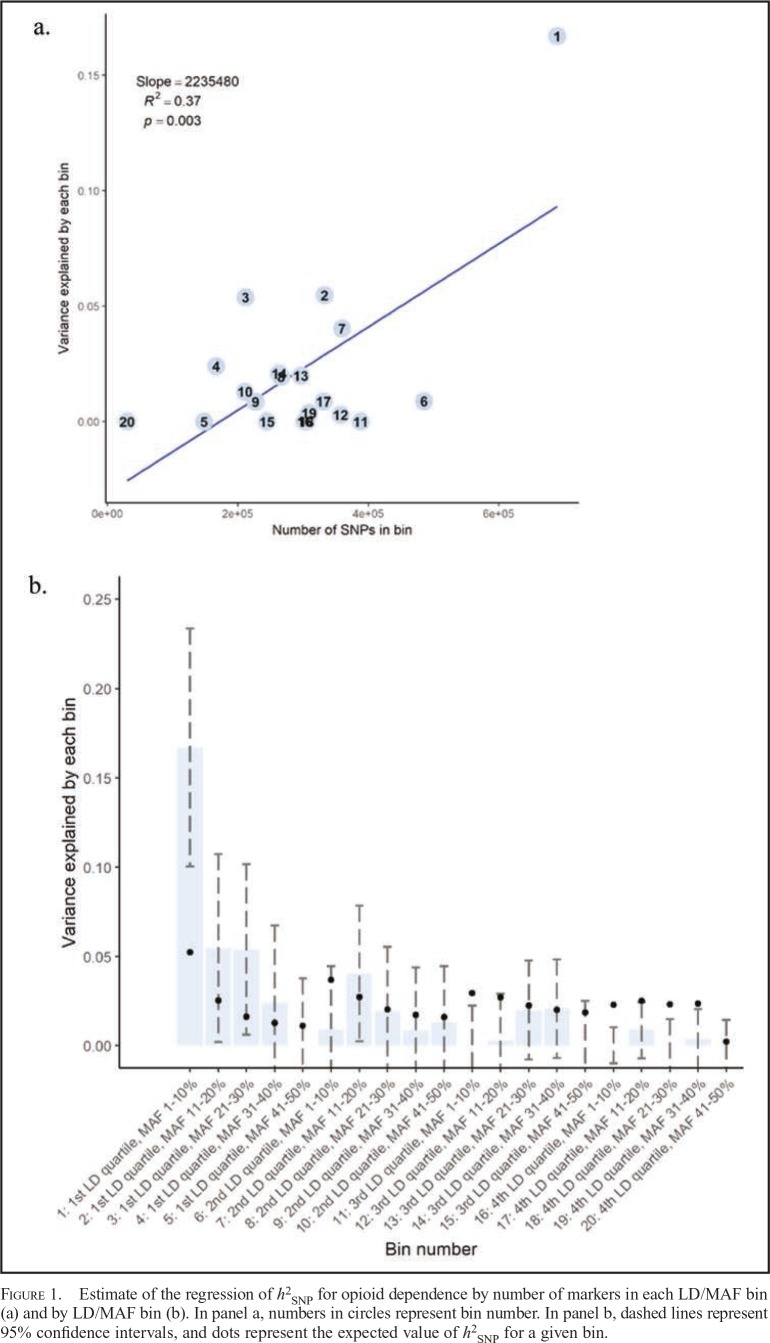
Figure 1.
Estimate of the regression of h2SNP for opioid dependence by number of markers in each LD/MAF bin (a) and by LD/MAF bin (b). In panel a, numbers in circles represent bin number. In panel b, dashed lines represent 95% confidence intervals, and dots represent the expected value of h2SNP for a given bin.

