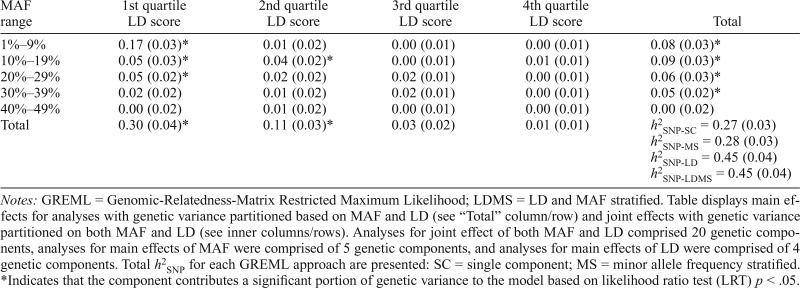
Table 2.
GREML-LDMS results: SNP-heritability (h2SNP) partitioned by minor allele frequency (MAF) and linkage disequilibrium (LD) score
| MAF range | 1st quartile LD score | 2nd quartile LD score | 3rd quartile LD score | 4th quartile LD score | Total |
| 1%–9% | 0.17 (0.03)* | 0.01 (0.02) | 0.00 (0.01) | 0.00 (0.01) | 0.08 (0.03)* |
| 10%–19% | 0.05 (0.03)* | 0.04 (0.02)* | 0.00 (0.01) | 0.01 (0.01) | 0.09 (0.03)* |
| 20%–29% | 0.05 (0.02)* | 0.02 (0.02) | 0.02 (0.01) | 0.00 (0.01) | 0.06 (0.03)* |
| 30%–39% | 0.02 (0.02) | 0.01 (0.02) | 0.02 (0.01) | 0.00 (0.01) | 0.05 (0.02)* |
| 40%–49% | 0.00 (0.02) | 0.01 (0.02) | 0.00 (0.01) | 0.00 (0.01) | 0.00 (0.02) |
| Total | 0.30 (0.04)* | 0.11 (0.03)* | 0.03 (0.02) | 0.01 (0.01) | h2SNP-SC = 0.27 (0.03) h2SNP-MS = 0.28 (0.03) h2SNP-LD = 0.45 (0.04) h2SNP-LDMS = 0.45 (0.04) |
Notes: GREML = Genomic-Relatedness-Matrix Restricted Maximum Likelihood; LDMS = LD and MAF stratified. Table displays main effects for analyses with genetic variance partitioned based on MAF and LD (see “Total” column/row) and joint effects with genetic variance partitioned on both MAF and LD (see inner columns/rows). Analyses for joint effect of both MAF and LD comprised 20 genetic components, analyses for main effects of MAF were comprised of 5 genetic components, and analyses for main effects of LD were comprised of 4 genetic components. Total h2SNP for each GREML approach are presented: SC = single component; MS = minor allele frequency stratified.
Indicates that the component contributes a significant portion of genetic variance to the model based on likelihood ratio test (LRT) p < .05.

