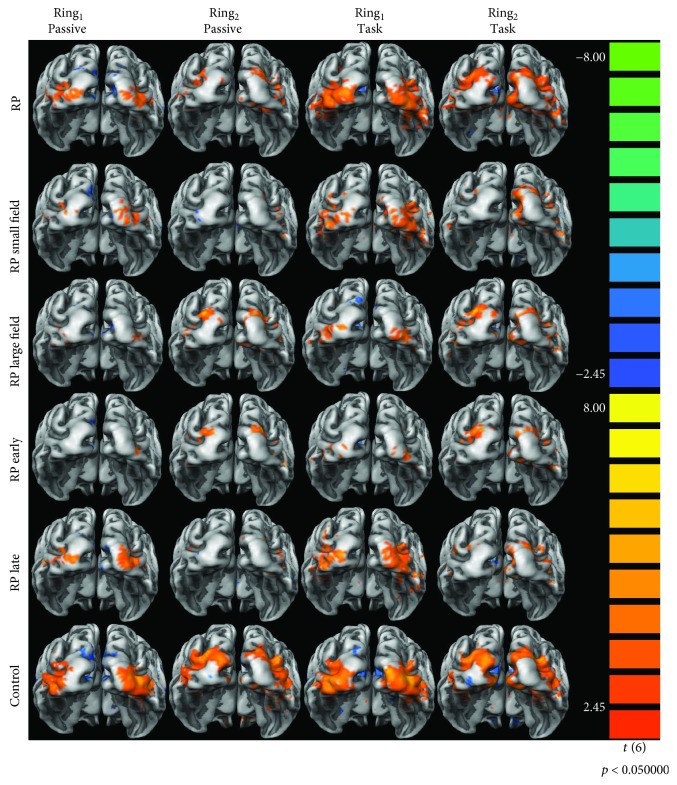
Figure 3.
Representation of the visual cortical responses for all the analyzed general linear model predictors (Ring1 Passive Viewing, Ring2 Passive Viewing, Ring1 Task, and Ring2 Task) for the Retinitis Pigmentosa group (RP) and the control group. The visual cortical activation is also represented for the subgroups of patients RPsvf (RP small field) with less than 9.52 deg of visual field diameter and RPlvf (RP large field) with more than 9.52 deg of visual field diameter. Finally, the visual cortical responses are also displayed for the subgroups of patients RPeo (RP early) with disease onset ages lower than 14 years and RPlo (RP late) with onset ages higher or equal to 14 years. Images represented the posterior view of both hemispheres meshes averaged for all participants. The colored scale represents the t-test value for the contrast predictor versus baseline with p < 0.050.

