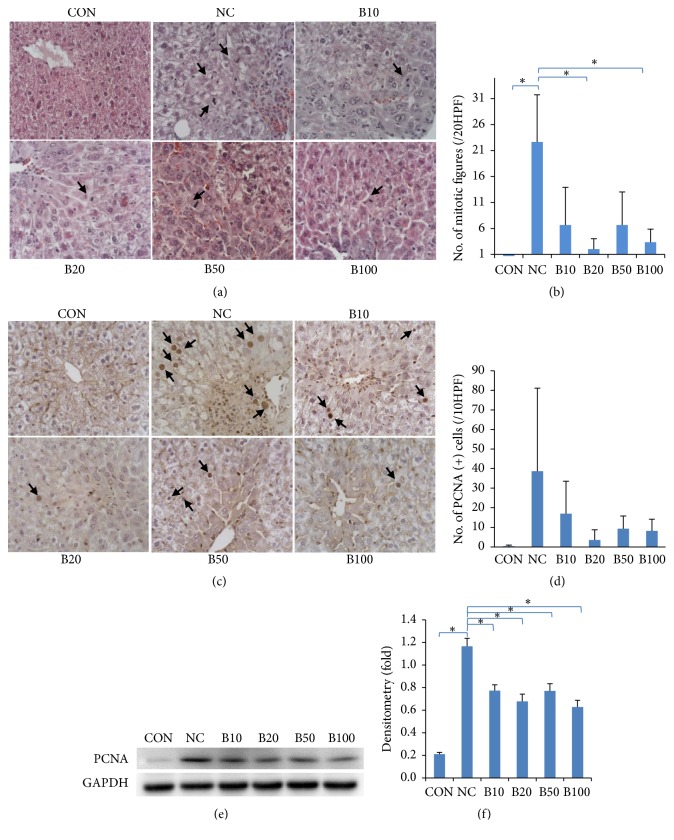
Figure 5.
Effect of nutria bile administration on hepatocyte proliferation in TAA-induced injury. (a) H&E staining of liver tissues. The number of mitotic figures (arrows) was elevated following TAA injection but was reduced in response to bile administration. Original magnification: 400×. (b) Comparison of the number of mitotic figures calculated in 10 HPF via microscopy. Bile treatment groups had a significant decrease in the number of mitotic figures compared to NC. (c) IHC of PCNA in liver tissues. PCNA-positive hepatocytes (arrows) were elevated following TAA injection but declined in response to bile treatment. Original magnification: 400×. (d) Comparison of the number of PCNA-positive cells counted in 10 HPF by microscopy. Bile treatment groups showed a decrease in proliferative response compared to NC. (e, f) Western blot analysis and quantification of PCNA expression. All bile treatment groups showed a significant decrease in PCNA expression compared to NC. Values are expressed as mean ± S.D. ∗p < 0.05 compared to NC.

