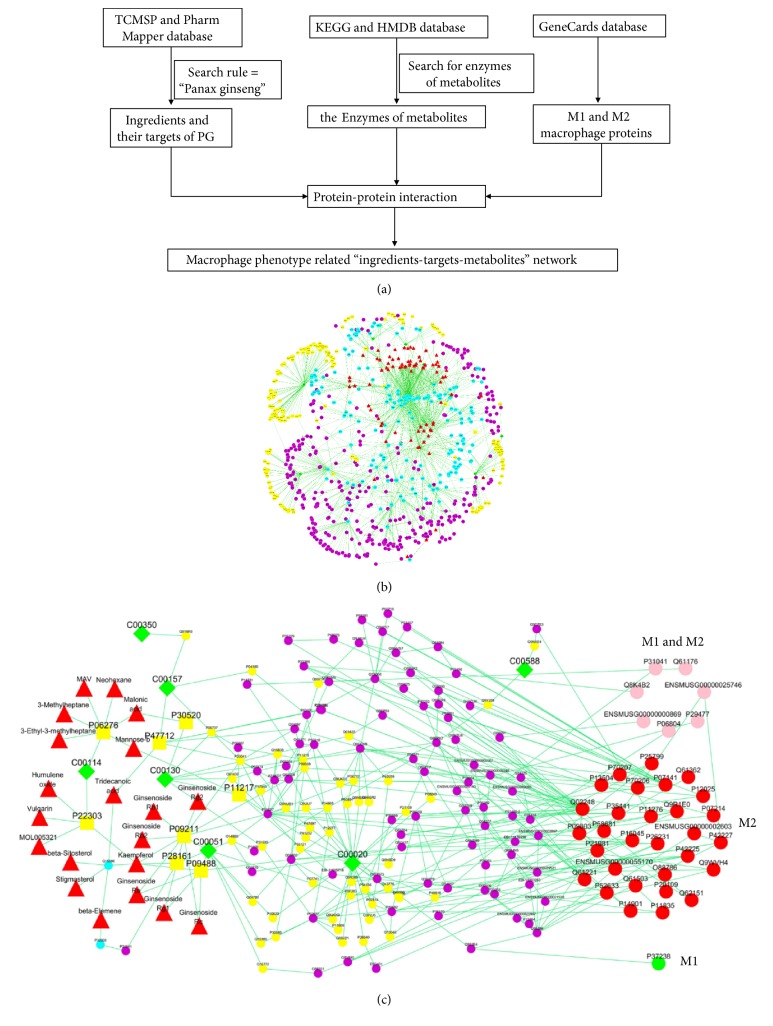
Figure 6.
Flow chart of network pharmacology analysis (a), the “ingredients-targets-metabolites” network of PG (b), and the macrophage phenotype related “ingredients-targets-metabolites” network (c). The red triangles represent the active chemical constituents of PG. The blue dots represent the targets for PG constituents. The green diamonds represent the metabolites. The yellow dots represent the metabolic proteins and the yellow squares represent the common proteins of PG constituents and metabolites. In figure (b), the pink dots represent common proteins in M1 and M2 macrophages. The red dots represent independent proteins in M1 macrophages and the green dots represent independent proteins in M2 macrophages.

