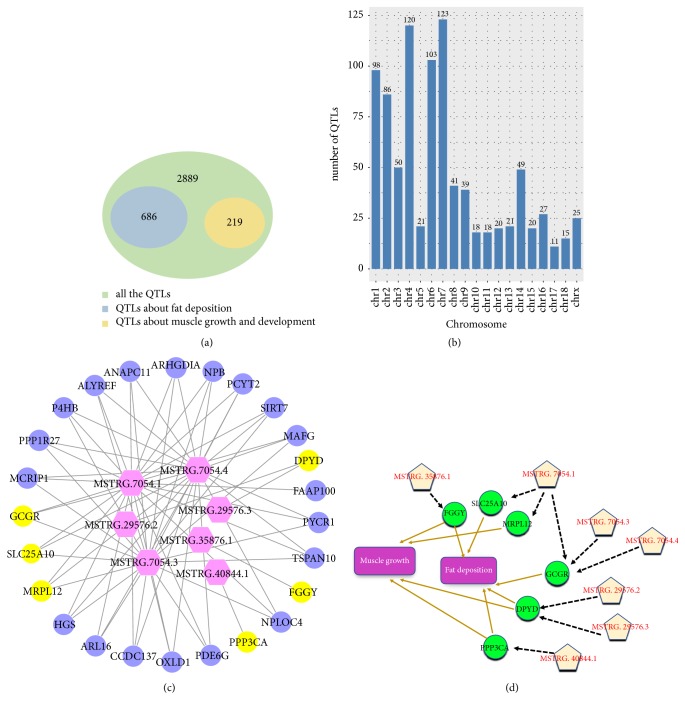
Figure 5.
(a) Venn diagram of QTLs associated with growth and fat deposition and all QTLs. (b) Distribution of lincRNAs involved in QTLs associated with growth and fat deposition on chromosomes. (c) The target genes within the range of 100kb for lincRNAs corresponding to QTLs related to muscle growth and fat deposition; the figure shows the relationship between these target genes and lincRNAs. (d) The target genes within the range of 10kb for lincRNAs corresponding to QTLs related to muscle growth and fat deposition; the figure shows the relationship between these target genes and lincRNAs and the relationship between these target genes and muscle growth or fat deposition.

