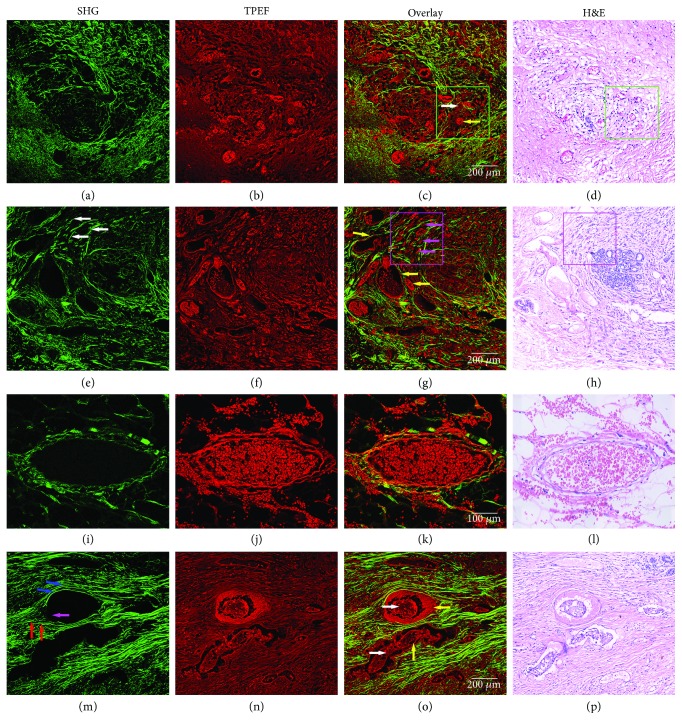
Figure 4.
SHG, TPEF, overlaid SHG/TPEF and corresponding H&E-stained image of the abnormal blood vessels in tumor microenvironment: (a–d) the macrophages and numerous microvessels around them (macrophages of white arrow and microvessels of yellow arrow), (e–h) the irregular blood vessels (blood vessels of yellow arrow, tumor cells of pink arrow, collagen fibers of white arrow), (i–l) blood vessels with abnormal leakage, and (m–p) blood vessels invaded by tumor cells (blood vessels of yellow arrow, tumor cells of white arrow, basement membrane of pink arrow, collagen fibers of blue and red). Scale bars: 100 μm (third row) and 200 μm (others).

