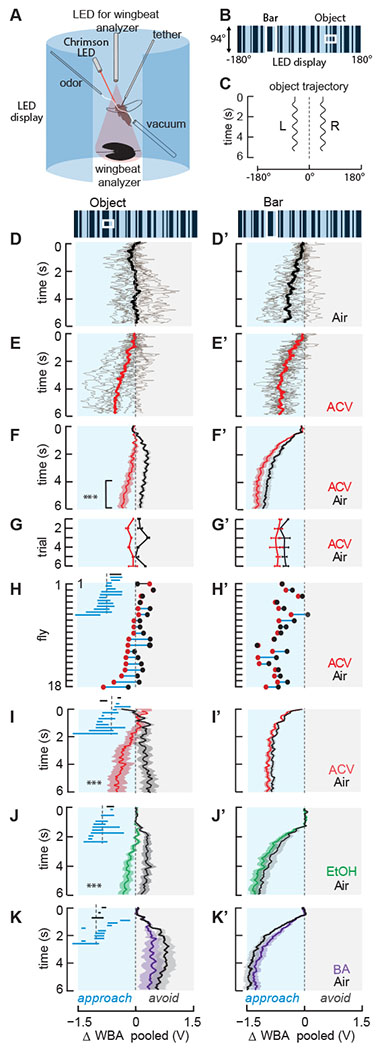
Figure 1. Odor-induced visual valence reversal is odorant specific and learning-independent.

(A) Schematic of the rigid-tether visual flight arena equipped for odor delivery and Chrimson optogenetics. The arena is comprised of an array of LED panels controlled by MATLAB. For odor experiments, green panels (570nm) were used, and an odor port was placed in front of the fly. For optogenetics experiments, blue panels (470nm) were used to minimize unwanted Chrimson activation, and a 685nm activating LED was placed in front of the fly. By convention, ΔWBA is defined as left wing beat amplitude (WBA) - right WBA. ΔWBA<0 corresponds to turning to the left, ΔWBA = 0 corresponds to the fly flying straight or maneuvering in pitch, and ΔWBA>0 corresponds to turning to the right.
(B) Representation of the visual stimuli used in all flight behavior experiments. Random ON-OFF columns comprised both background and object stimuli. A 30×30° square object and 30×94° vertical bar were oscillated sinusoidally at 1Hz.
(C) Stimulus trajectory: ±15° peak-to-peak amplitude centered at ±45° from midline, left or right side selected at random for each trial.
(D,D’) Individual repeated trials (gray) by a single fly when each visual stimulus was shown in air, superimposed with the mean ΔWBA response across trials (black). Data from right and left side presentations are inverted and pooled as if all visual stimuli were presented on the left side of the arena. Blue shaded rectangle (negative ΔWBA) indicates when flies are steering toward the visual stimuli (“approach”), and gray rectangle indicate flies steering to “avoid” the stimuli.
(E,E’) Same fly as in panel D, with same visual stimuli, in in a plume of ACV. Note valence reversal for the small object (E).
(F,F’) Mean ΔWBA (solid line) and SEM (shaded regions) for a population of wild-type PCF flies in response to an object (F) or bar (F’) in air (black) or ACV (red). Bracket denotes the final two second epoch used to measure average responses for statistical analysis. Asterisks denote odor-induced visual valence reversal, n=18 p <0.01, Student’s paired t-test.
(G,G’) Mean ΔWBA and SEM for each consecutive trial, averaged across flies, n=18.
(H,H’) Mean ΔWBA of each fly in air (black) and ACV (red), sorted by ΔWBA values. Dots representing mean responses in clean air and ACV from the same fly are joined by a horizontal line. The dots are connected by a blue line for ACV-induced steering shifts toward the visual object and a black line for ACV shifts away from the object. This larger representation demonstrates how we made the inset, which is included in subsequent plots and figures. Inset: same as larger plot, but with dots removed. 12 out of 18 flies shifted their steering effort toward the visual object (blue line) when ACV was presented, and 1 out of 18 steered farther away (black line). Steering responses to the small object that were not influenced by ACV had no segment length value to plot and hence are not indicated, but were included in average points and statistical analyses.
(I,I’) Same as row (F) for WT-OregonR flies. Asterisks indicate odor-induced visual valence switch, n=13 *** p<0.01.
(J,J’) Same as row (F) for ethanol, n=13, *** p<0.01.
(K,K’) Same as row (F) for an aversive odorant, benzaldehyde, n=14.
See also Figure S1.
