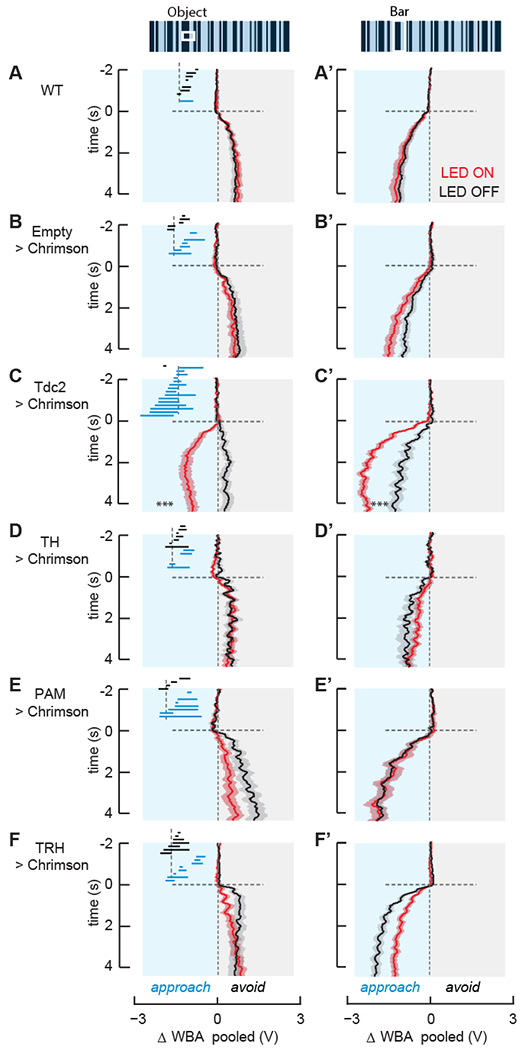
Figure 2. Optogenetic activation of aminergic neurons reveal that OA is sufficient for odor-induced visual valence reversal.

All panels - mean ΔWBA (solid lines) and SEM (shaded regions) to an object (A-F) or bar (A’-F’) in LED Off (black) or LED On (red) conditions. Each row represents flies of the genotype indicated. In LED On trials, the LED is switched on at time 0. Insets as in Figure 1 denote whether each fly steered more towards (blue) or away from (black) the stimulus upon Chrimson activation. Horizontal dashed line represents the onset of visual stimulus (time = 0). Vertical, dashed gray line represents visual midline (ΔWBA = 0).
(A, A’) n=11; (B, B’) n=12; (C, C’) n=16; (D, D’) n=13; (E, E’) n=12; (F, F’) n=16.
***p<<0.01, Student’s paired t-test of the last 2 seconds
See also Figure S2.
