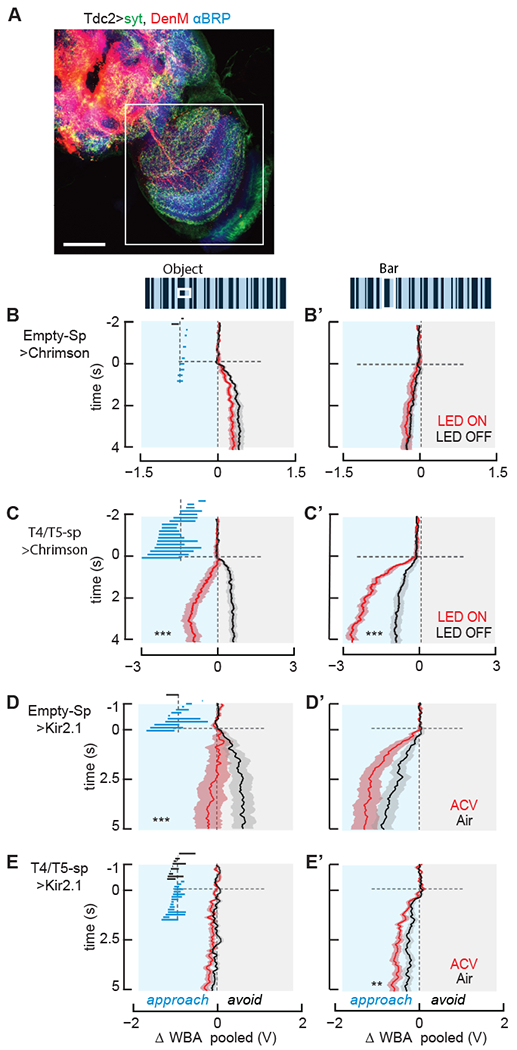
Figure 3. Hyperpolarizing T4/T5 neurons eliminates object responses, depolarizing them induces visual valence reversal.

(A) Distribution of presynaptic and dendritic neurites of Tdc2-Gal4 neurons. Red = DenMark labeling; Green = synaptotagmin labeling; Blue = anti-BRP labeling. Me: medulla; Lo: lobula; LoP: lobula plate; SEZ: subesophgeal zone.
(B,B’) Genetic controls, enhancerlessless split-gal4 driving UAS-Chrimson, n=19. Mean ΔWBA (solid line) and SEM (shaded region) to an object (B) or bar (B’) in LED Off (black) or On (red). Inset: as in Figure 1.
(C,C’) Same as B for optogenetic depolarization of T4/T5 neurons, n=18 *** p<<0.01, Student’s paired t-test of the last 2 seconds.
(D,D’) Genetic controls, enhancerless split-Gal4 driving UAS-Kir2.1, for hyperpolarizing T4/T5 neurons. Mean ΔWBA (solid line) and SEM (shaded region) to an object (D) or bar (D’) in clean air (black) or ACV (red) n=13 *** p<<0.01. Inset: as in Figure 1.
(E,E’) Same as D, results of hyperpolarizing T4/T5 using Kir2.1, n=27 ** p<0.01, Student’s paired t-test of the last 2 seconds.
See also Figure S3.
