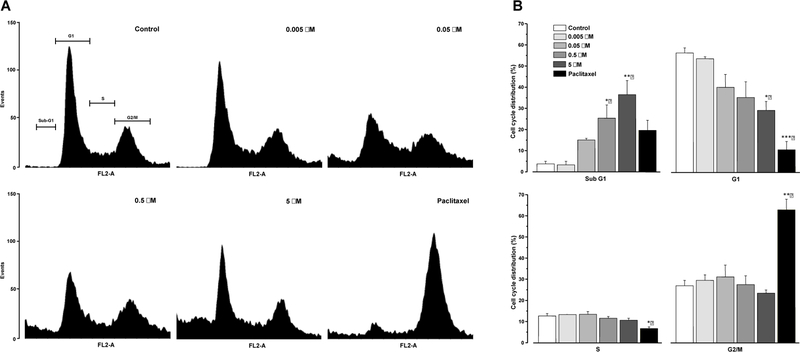
Figure 2.
(A) Effect of corchorusoside C (1) on the cell cycle distribution in DU-145 prostate cancer cells. Cells were treated for 24 h with 1 (0–5 μM) and then stained with PI. Following flow cytometry, the cellular DNA profile was analyzed using the software WinMDI 2.8. (B) Data represent the percentage of cell counts in each cell cycle phase. The results are expressed as the means ± SEM of two independent experiments. *p ≤ 0.05, **p ≤ 0.01, and ***p ≤ 0.001 for significant differences against control treatment.

