
Figure 5.
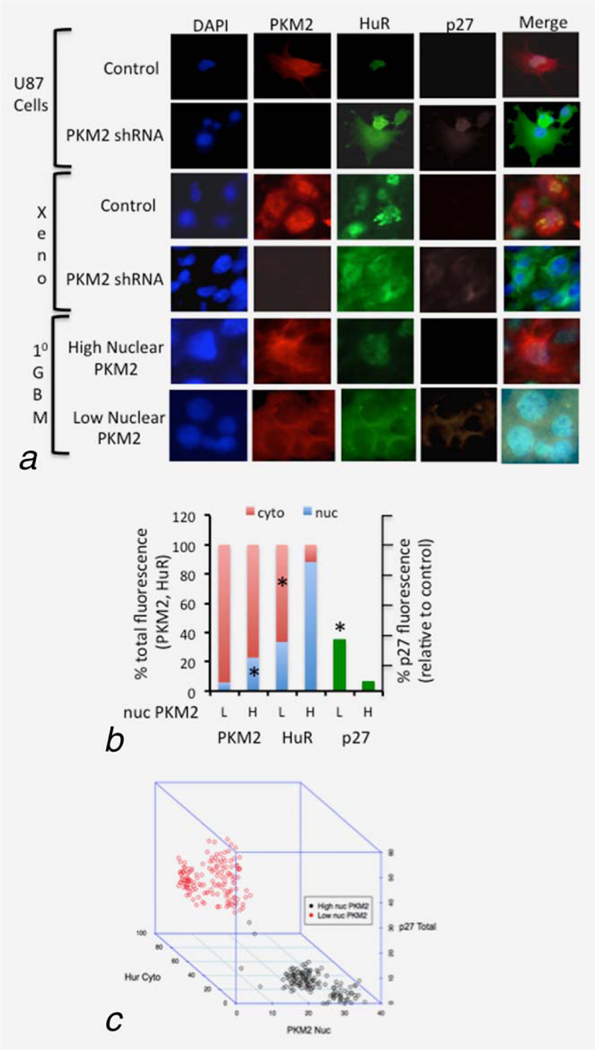
Levels of nuclear PKM2 correlate inversely with cytoplasmic HuR and p27 expression in vitro and in human GBM samples. (a) Representative results from immunofluorescence analysis of PKM2 (red), HuR (green) and p27(violet) nuclear/cytoplasmic expression in control and PKM2 shRNA U87 cells in vitro, the same cells grown as intracranial tumor xenografts (xeno), and of primary human GBM determined by PKM2 immunohistochemistry to have high or low expression of nuclear PKM2. (b) Average sub-cellular distribution of PKM2 and HuR immunofluorescence (left) and of total p27 immunofluorescence (right, normalized to infiltrated immune cells) in 50 cells from each of three primary human GBM determined by PKM2 immunohistochemistry to have low (L) or high (H) expression of nuclear PKM2. *,p<.05, n5150. (c) Three-dimensional plot of cytoplasmic HuR, nuclear PKM2 and total p27 immunofluorescence from 300 individual cells derived from three primary human GBM with low (black circles) or high (red circles) expression of nuclear PKM2, each. See also Supporting Information Figure S4a and Table S1.