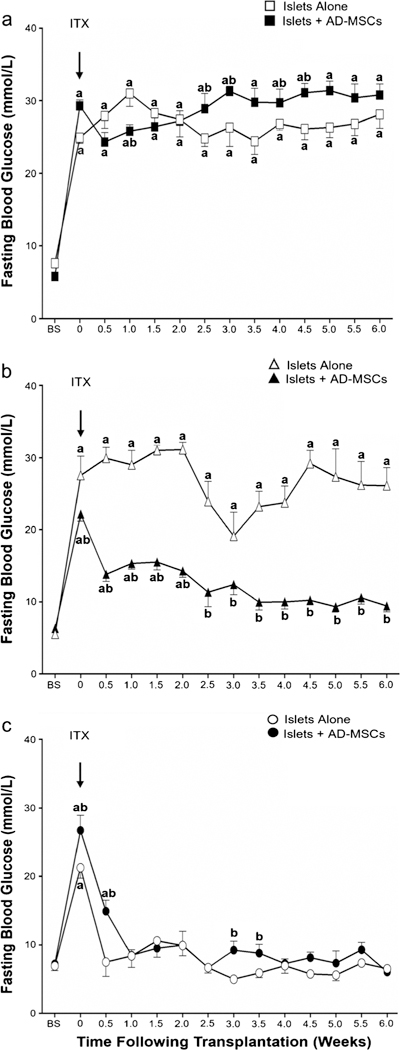
Fig. 1.

Fasting blood glucose levels in mice following islet transplantation. Values represent the mean ± S.E.M. at baseline (BS), islet transplantation (ITX arrow), and at week (W) 0.5, 1.0, 1.5, 2.0, 2.5, 3.0, 3.5, 4.0, 4.5, 5.0, 5.5, and 6.0 following islet transplantation. Animals received either 75 islets alone (white square), 75 islets with AD-MSCs (black square), 150 islets alone (white up-pointing triangle), 150 islets with AD-MSCs (black up-pointing triangle), 225 islets alone (white circle), and 225 islets with AD-MSCs (black circle). Significant differences: aP < 0.05, baseline vs. all other time points; bP < 0.05, islets alone vs. islets + AD-MSCs (two-way RM ANOVA with post hoc Tukey test)
