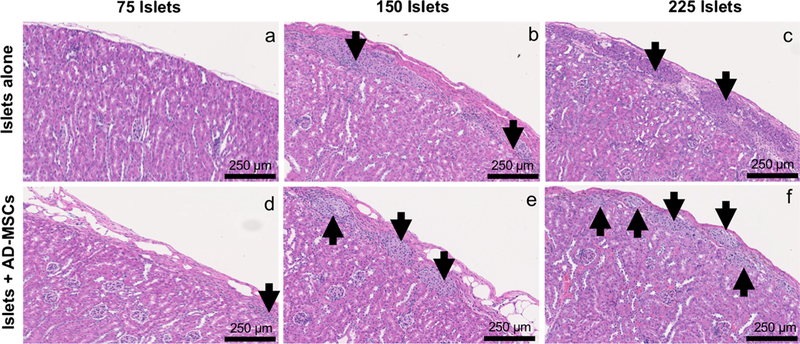
Fig. 2.

The morphology of transplanted islets. Representative H&E images of 75, 150, or 225 islets that were transplanted under the kidney capsule, either alone (a–c) or with AD-MSCs (d–f), at 6 weeks following transplantation. Arrows indicate islets present within the representative images
