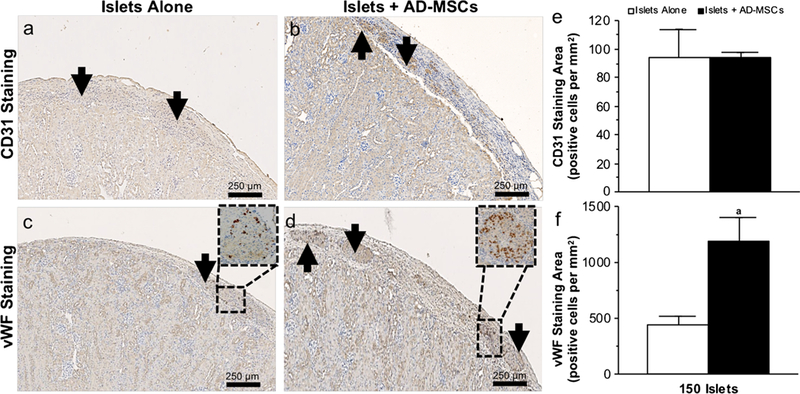
Fig. 4.

The vascular index of transplanted islets. a–d Representative images following CD31 (a, b) and vWF (c, d) immunohistochemical staining of 150 islets that were transplanted under the kidney capsule, either alone or with AD-MSCs, at 2 weeks following transplantation. Arrows indicate islets present within the representative images. Magnified views of the box region were shown for vWF. e, f Quantification of the positive CD31 and vWF staining in samples where 150 islets were either transplanted alone (white square) or with AD-MSCs (black square). Significant differences: aP < 0.05 for islets alone vs. islets + AD-MSCs (Student’s unpaired t test)
