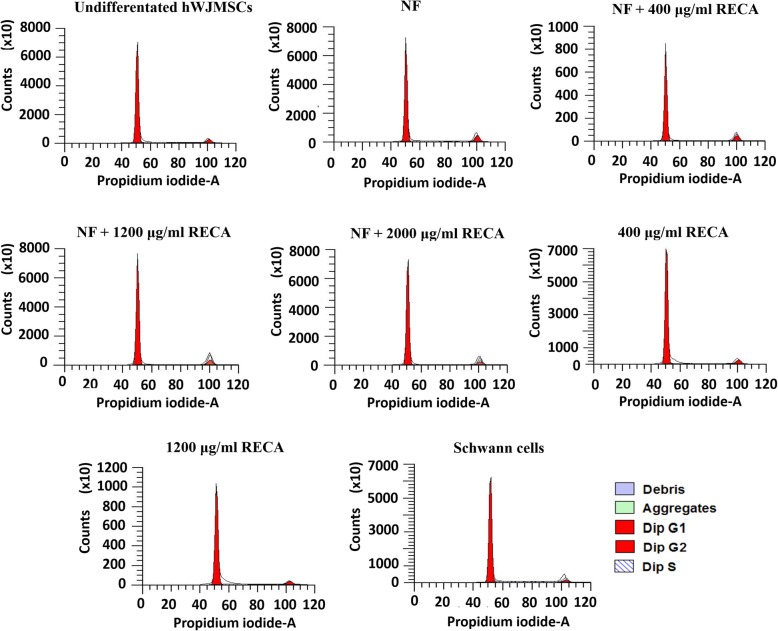
Fig. 10.
DNA histogram showing the distribution of the hWJMSC population in each experimental group for different cell cycle phases (G0/G1, S and G2/M phase). The x-axis represents the relative fluorescence intensity proportional to the DNA content. A similar cell cycle pattern was observed in all experimental groups, and most of the cultured cells were in the G0/G1 phase (n = 3)

