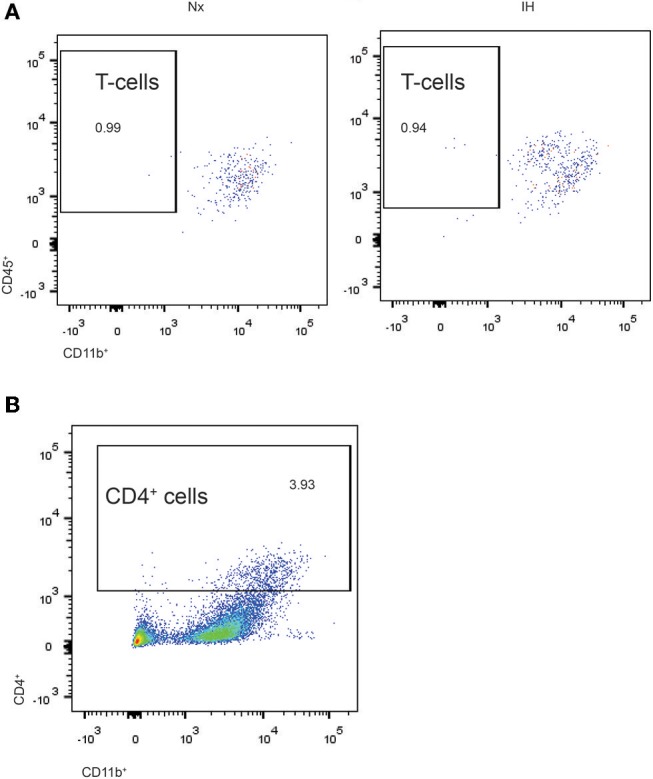
Figure 6.

Flow cytometry analysis of CD4+ cells in whole brains isolated from neonatal rats. (A) CD4+ cells were gated and analyzed for concomitant CD45 and CD11b expression in Nx and IH conditions. T cells exhibit high CD45 with low CD11b expression. (B) Approximately 3–4% of total live cells were CD4+, the majority of which were high in both CD11b and CD45 expression; microglia are CD11b+/CD45low.
