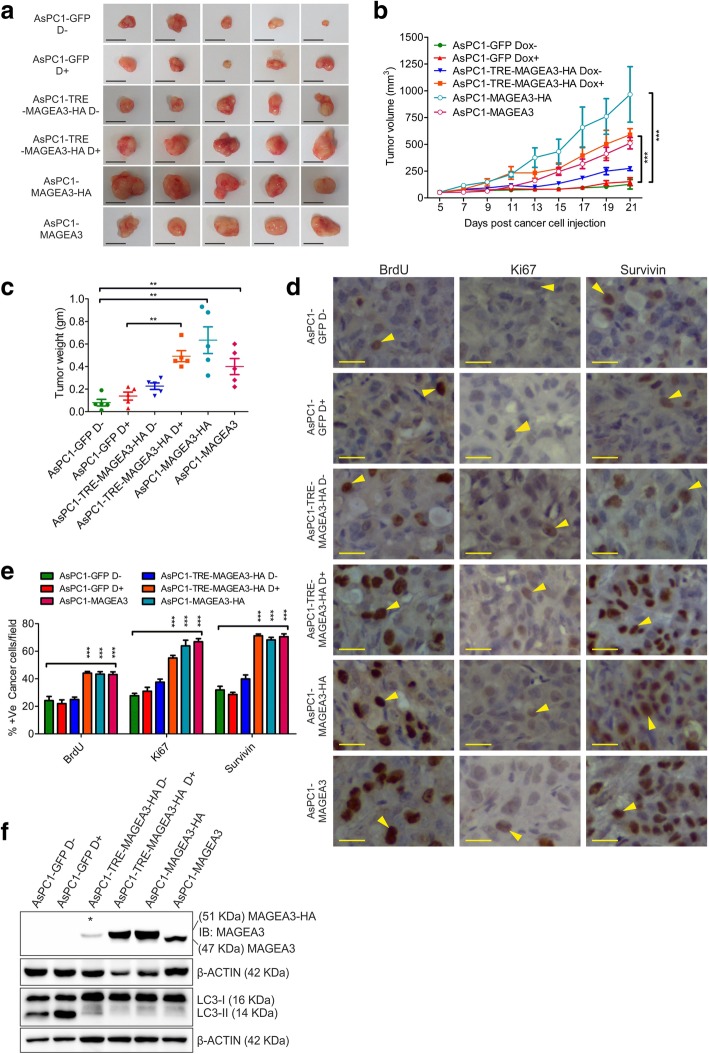
Fig. 6.
MAGEA3 expression results into increased tumor progression in vivo. a Digital images of the whole tumor isolated from mice; scale bar =1 cm, AsPC1-MAGEA3 or AsPC1-MAGEA3-HA refers to AsPC1-pLentiMAGEA3 or AsPC1-pLentiMAGEA3-HA in constitutive expression system. b The graph showing tumor growth kinetics in vivo. *** = p < 0.001, n = 5. c The graph showing the tumor weight measured after isolation. ** = p < 0.005, n = 5. d, e Immunohistochemical analysis showing representative images of BrdU, Ki67 and survivin positive cells in the tumor tissues of different groups (d). Quantification of cells positive for BrdU, Ki67 and survivin are presented through bar graphs (e). Scale bar = 25 μm. *** = p < 0.001, n = 5. f Immunoblot of protein samples from tumor tissue showing reduced authophagic marker LC3-II in MAGEA3 expressing xenografts. Star above the band indicates the leaky expression of MAGEA3-HA protein

