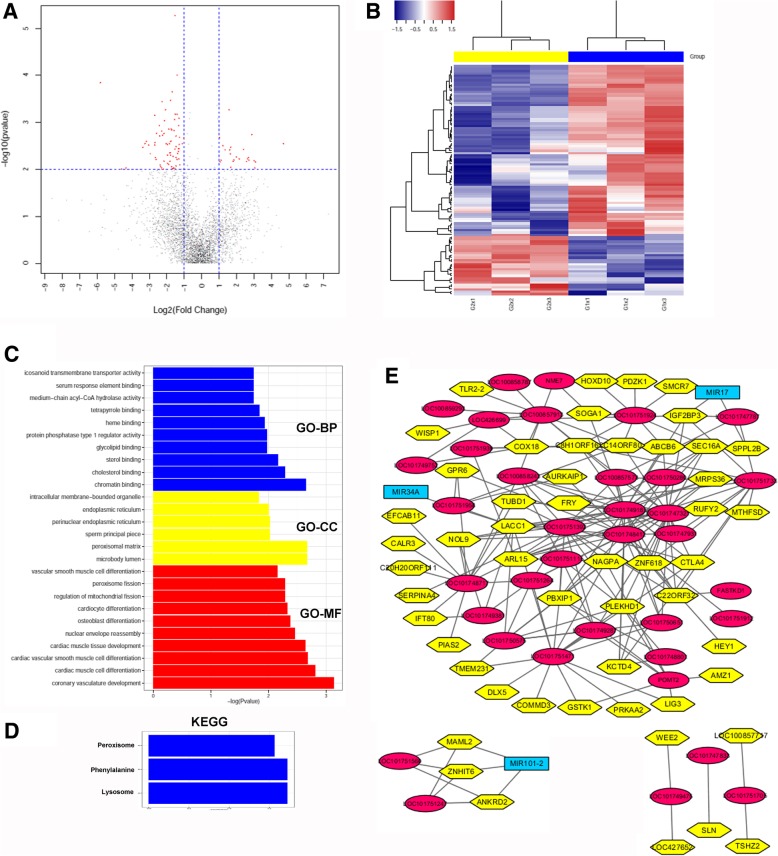
Fig. 4.
LncRNA microarray analysis of IBV-stimulated avian BMDCs. a Volcano plot map of lncRNA expression levels in control avian BMDCs and IBV-stimulated avian BMDCs at 12 h post-infection. A comparison of expression data was performed using XY-scatter plot analysis of the log base two-fold change. Data points shown in red represent significantly differentially expressed genes; P < 0.01. b Heat map of differentially expressed lncRNAs in IBV-stimulated avian BMDCs. All biological replicates were pooled to identify differentially expressed lncRNAs based on a threshold fold change > 2 and P < 0.01. The blue and yellow colours represent the two groups, with blue showing the control group, with G1 × 1, G1 × 2, G1 × 3 at the bottom, whereas yellow represents IBV-infected DCs, with G2 × 1, G2 × 2, G2 × 3 at the bottom.c Primary GO categorisation based on cis-, trans-, and co-expressed target genes of differentially expressed lncRNAs in IBV-stimulated avian BMDCs.d KEGG pathway analysis based on target genes of differentially expressed lncRNAs in IBV-stimulated avian BMDCs. e Potential interaction network among significantly differentially expressed lncRNAs and target genes, created using Cytoscape (The pink ellipse represents co-expressed lncRNAs, while the yellow hexagon represents co-expressed mRNAs). All biological replicates were pooled to identify differentially expressed lncRNAs based on a threshold fold change > 2 and P < 0.01

