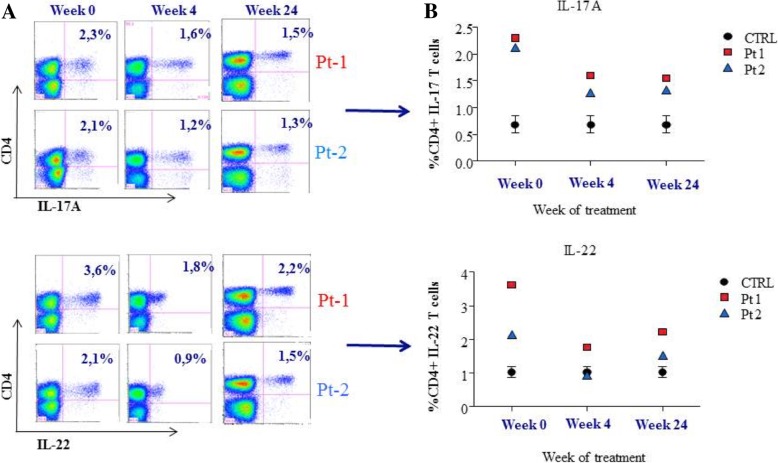
Fig. 3.
Percentange of circulating Th17 (IL-17A) and Th22 (IL-22) in stimulated PBMCs of CAMPs patients before and after ustekinumab treatment. a On the left, representative flow cytometry dot plots of the intracellular expression of IL-17 and IL-22 from CAMPS patients (Pt) (at baseline, at week 4 and at week 24); (b) On the right: the change in circulating frequency of Th17 and Th22 cells in CAMPS patients and pediatric healthy controls (CTRLs) before and after ustekinumab treatment (at baseline, at week 4, at week 16). Each point represents a sample

